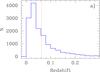
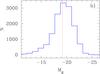
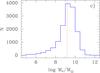
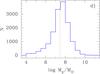
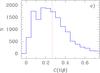
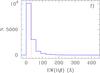
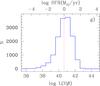
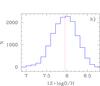
Fig. 3

Distribution of the SDSS emission-line galaxies a) over redshift z; b) over extinction-corrected absolute- SDSS g-magnitude Mg; c) over total stellar mass M∗; d) over mass My of the young stellar population; e) over the extinction coefficient C(Hβ); f) over the equivalent width EW(Hβ) of the Hβ emission line; g) over the extinction- and aperture-corrected Hβ luminosity L(Hβ) (lower axis) and the star-formation rate SFR (upper axis); and h) over the oxygen abundance 12 +log O/H (h). Dotted vertical lines in all panels indicate mean values of the distributions.
Current usage metrics show cumulative count of Article Views (full-text article views including HTML views, PDF and ePub downloads, according to the available data) and Abstracts Views on Vision4Press platform.
Data correspond to usage on the plateform after 2015. The current usage metrics is available 48-96 hours after online publication and is updated daily on week days.
Initial download of the metrics may take a while.