Fig. 9
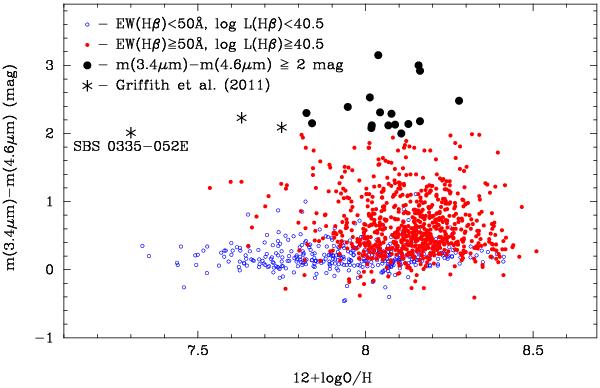
m(3.4 μm)−m(4.6 μm) vs. 12 +log O/H diagram for a sample of emission-line galaxies detected in WISE 3.4 μm (W1) and 4.6 μm (W2) bands. Galaxies with Hβ equivalent width EW(Hβ) ≥ 50 Å and with L(Hβ) ≥ 3 × 1040 erg s-1 are shown by red filled circles while galaxies with EW(Hβ) < 50 Å and with L(Hβ) < 3 × 1040 erg s-1 are shown by blue open circles. Galaxies with m(3.4 μm)−m(4.6 μm)≥ 2 mag from this paper are shown by large black filled circles and from Griffith et al. (2011) by asterisks. Only the galaxies where the errors in [O iii] λ4363 emission-line flux do not exceed 50% are shown.
Current usage metrics show cumulative count of Article Views (full-text article views including HTML views, PDF and ePub downloads, according to the available data) and Abstracts Views on Vision4Press platform.
Data correspond to usage on the plateform after 2015. The current usage metrics is available 48-96 hours after online publication and is updated daily on week days.
Initial download of the metrics may take a while.