Fig. 6
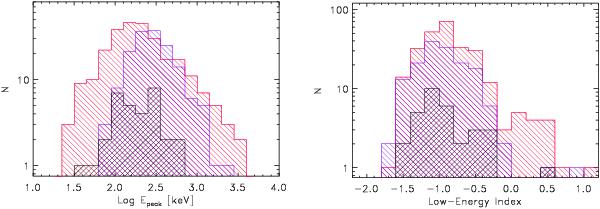
Distribution of the spectral peak energies (left) and the low-energy spectral power-law indices (right). The sample of INTEGRAL GRBs is shown in black; BATSE results (violet) and Fermi/GBM results (red) of the time-integrated spectral analysis were used for comparison. Only long events were selected, fitted with the Band or cut-off power-law model, and having a fluence in the same range as INTEGRAL GRBs.
Current usage metrics show cumulative count of Article Views (full-text article views including HTML views, PDF and ePub downloads, according to the available data) and Abstracts Views on Vision4Press platform.
Data correspond to usage on the plateform after 2015. The current usage metrics is available 48-96 hours after online publication and is updated daily on week days.
Initial download of the metrics may take a while.