Fig. 4
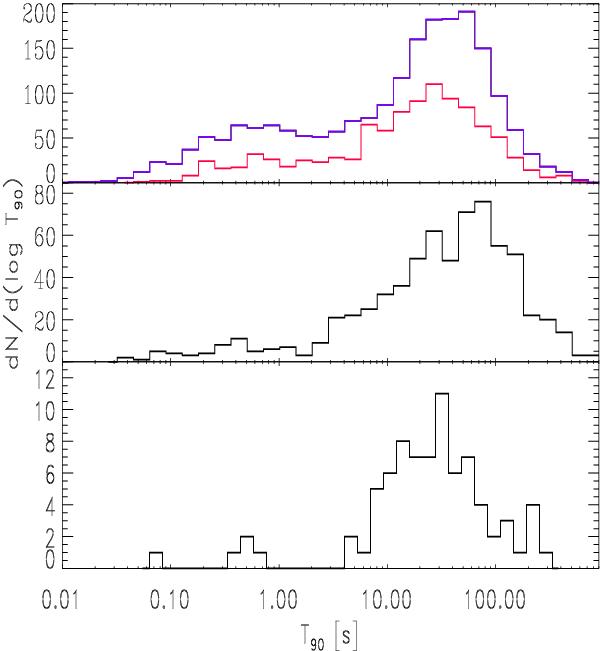
Distribution of the duration T90. Top: distribution of durations derived from BATSE (violet) and Fermi/GBM (red) light curves in the 50−300 keV band (c.f. Kouveliotou et al. 1993; Paciesas et al. 2012). Middle: T90 durations derived using Swift/BAT instrument on 15−150 keV (c.f. Sakamoto et al. 2011). Bottom: distribution of durations for 20−200 keV light curves obtained from IBIS/ISGRI.
Current usage metrics show cumulative count of Article Views (full-text article views including HTML views, PDF and ePub downloads, according to the available data) and Abstracts Views on Vision4Press platform.
Data correspond to usage on the plateform after 2015. The current usage metrics is available 48-96 hours after online publication and is updated daily on week days.
Initial download of the metrics may take a while.