Free Access
Fig. 3
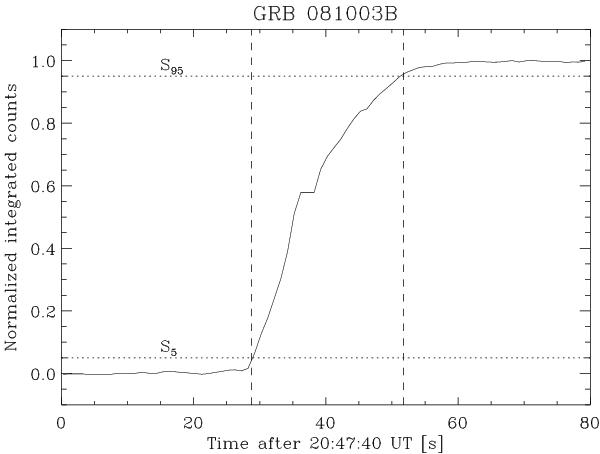
Example of T90 calculation using the time-integrated IBIS/ISGRI light curve of GRB 081003B. The vertical dashed lines represent the times when the GRB integrated counts exceed 5% (S5) and 95% (S95) of the maximal integrated flux value, respectively.
Current usage metrics show cumulative count of Article Views (full-text article views including HTML views, PDF and ePub downloads, according to the available data) and Abstracts Views on Vision4Press platform.
Data correspond to usage on the plateform after 2015. The current usage metrics is available 48-96 hours after online publication and is updated daily on week days.
Initial download of the metrics may take a while.