Fig. 3
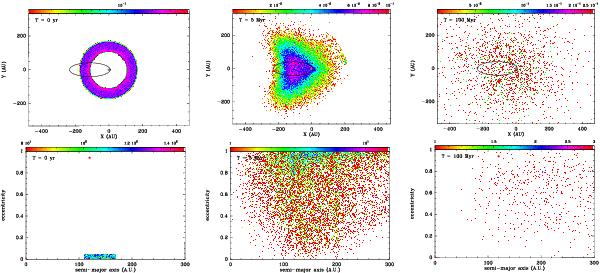
Result of the N-body integration with a perturbing planet with m = 1 MJup. We display here upper views of the planetesimal disk together with the planet’s orbit (top) and semi-major axis–eccentricity diagrams of the disk (bottom), at three epochs: beginning of the simulation (t = 0, left), at t = 5 Myr (middle) and t = 100 Myr (right). The color scale is proportional to the projected densities of particles (top plots) and of orbits in (a,e) space (bottom plots). The red circles represent the location of the star and of the planet. The planet’s orbit is sketched as a black ellipse.
Current usage metrics show cumulative count of Article Views (full-text article views including HTML views, PDF and ePub downloads, according to the available data) and Abstracts Views on Vision4Press platform.
Data correspond to usage on the plateform after 2015. The current usage metrics is available 48-96 hours after online publication and is updated daily on week days.
Initial download of the metrics may take a while.