Fig. 2
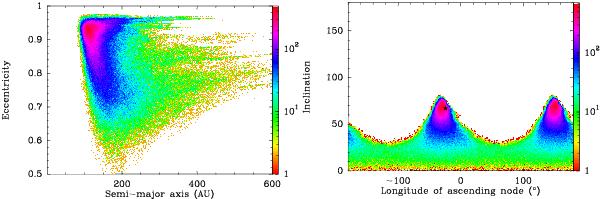
Resulting 2D MCMC distribution of Fom b’s orbital elements for two couples of parameters, for the run with the full Kalas et al. (2013) data: semi-major axis (a)–eccentricity (e) (left); longitude of ascending node (Ω)–inclination (i) (right). The color scale represents the joint 2D density of solutions for the considered set of parameters. In the right plot, the star indicates the corresponding location of the mid-plane of the dust disk (Kalas et al. 2005). The same plot using Galicher et al. (2013) data is almost identical.
Current usage metrics show cumulative count of Article Views (full-text article views including HTML views, PDF and ePub downloads, according to the available data) and Abstracts Views on Vision4Press platform.
Data correspond to usage on the plateform after 2015. The current usage metrics is available 48-96 hours after online publication and is updated daily on week days.
Initial download of the metrics may take a while.