Fig. 1
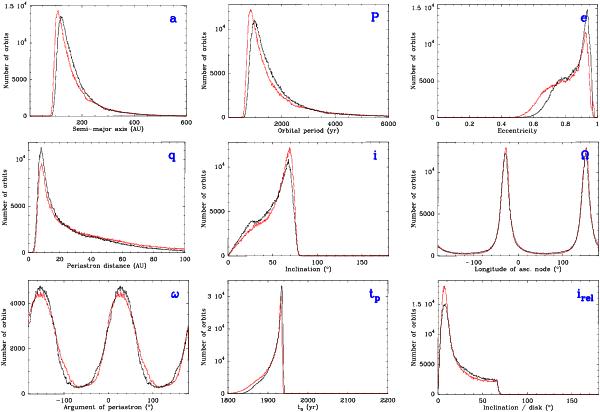
Resulting MCMC distribution of the orbital elements of Fom b’s orbit. In all plots, the black curves correspond to the first run using the full Kalas et al. (2013) data, and the red one to the second run using Galicher et al. (2013) data before 2012. Upper row, from left to right: semi-major axis (a), orbital period (P), eccentricity (e); second row, id: periastron (q), inclination (i), longitude of ascending node (Ω); third row, id: argument of periastron (ω), time for periastron passage (tp), and inclination relative to the disk plane (irel).
Current usage metrics show cumulative count of Article Views (full-text article views including HTML views, PDF and ePub downloads, according to the available data) and Abstracts Views on Vision4Press platform.
Data correspond to usage on the plateform after 2015. The current usage metrics is available 48-96 hours after online publication and is updated daily on week days.
Initial download of the metrics may take a while.