Free Access
Fig. 7
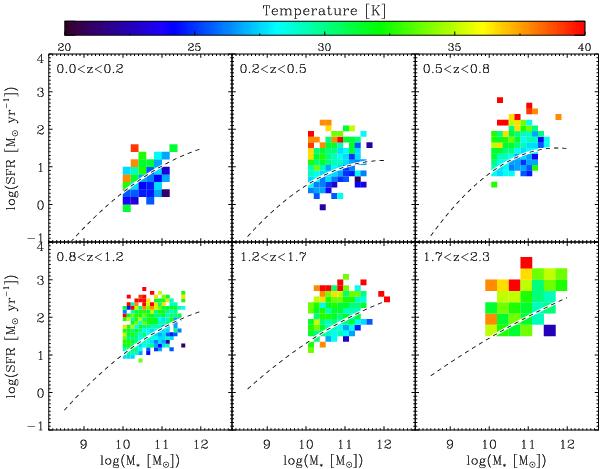
Mean dust temperature of galaxies in the SFR− M∗ plane as found from our stacking analysis. Short-dashed lines on a white background show the MS of star formation. Tracks of iso-dust-temperature are not characterised by vertical or horizontal lines but instead by approximately diagonal lines.
Current usage metrics show cumulative count of Article Views (full-text article views including HTML views, PDF and ePub downloads, according to the available data) and Abstracts Views on Vision4Press platform.
Data correspond to usage on the plateform after 2015. The current usage metrics is available 48-96 hours after online publication and is updated daily on week days.
Initial download of the metrics may take a while.