Fig. 5
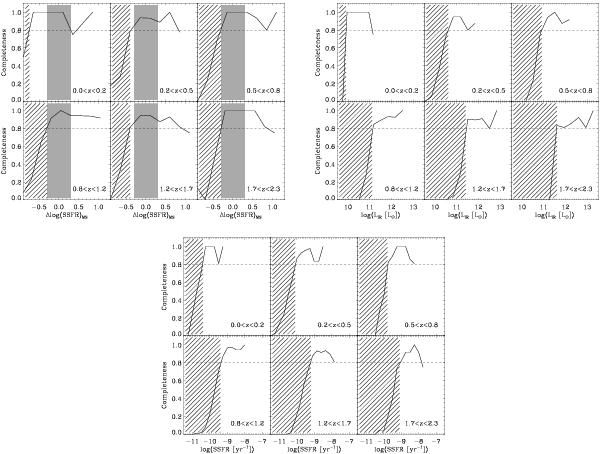
Fraction of SFR− M∗ bins with M∗ > 1010 M⊙ and with accurate dust temperature estimates (see Sect. 3.1) in our stacking analysis as function of their Δlog (SSFR)MS (top left panel), LIR (top right panel) or SSFR (bottom panel). Horizontal dashed lines represent the 80% completeness limits. Hatched areas represent the regions of parameter space affected by incompleteness, i.e., where less than 80% of our SFR− M∗ bins have accurate dust temperature estimates. Shaded regions in the top left panel show the location and dispersion of the MS of star formation.
Current usage metrics show cumulative count of Article Views (full-text article views including HTML views, PDF and ePub downloads, according to the available data) and Abstracts Views on Vision4Press platform.
Data correspond to usage on the plateform after 2015. The current usage metrics is available 48-96 hours after online publication and is updated daily on week days.
Initial download of the metrics may take a while.