Fig. 3
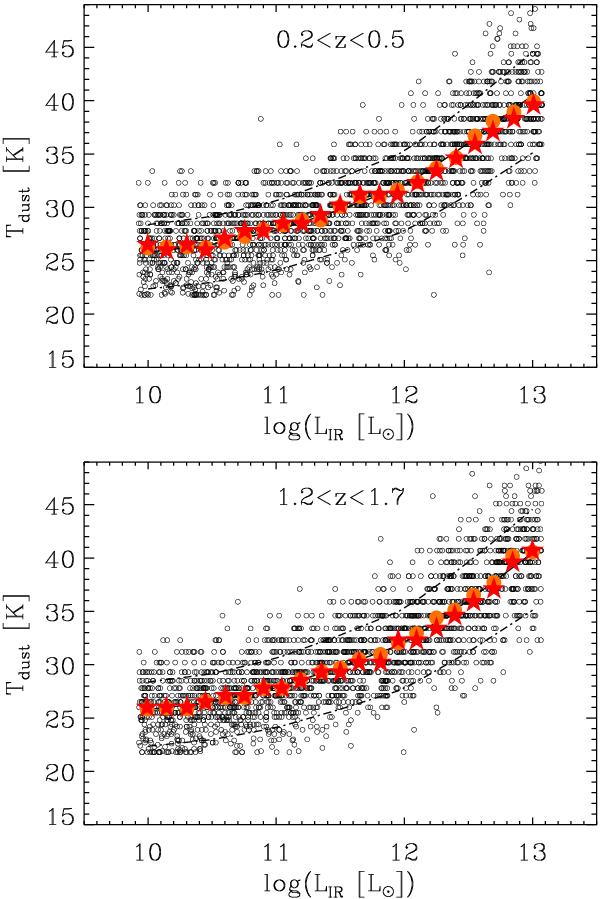
Simulations revealing the effects of stacking on our dust temperature estimates. Empty black circles represent our 1000 simulated galaxies following the Tdust − LIR correlation of Chapman et al. (2003). Large filled orange circles represent the mean dust temperature of galaxies in a given infrared luminosity bin. Large filled red stars represent the dust temperature inferred from the mean PACS/SPIRE flux densities of galaxies in a given infrared luminosity bin. The Chapman et al. (2003) derivation of the median and interquartile range of the Tdust − LIR relation observed at z ~ 0 is shown by solid and dash-dotted lines, linearly extrapolated to 1013 L⊙. In the top panel, simulated galaxies are in the 0.2 < z < 0.5 redshift bin, while in the bottom panel simulated galaxies are in the 1.2 < z < 1.7 redshift bin.
Current usage metrics show cumulative count of Article Views (full-text article views including HTML views, PDF and ePub downloads, according to the available data) and Abstracts Views on Vision4Press platform.
Data correspond to usage on the plateform after 2015. The current usage metrics is available 48-96 hours after online publication and is updated daily on week days.
Initial download of the metrics may take a while.