Fig. 2
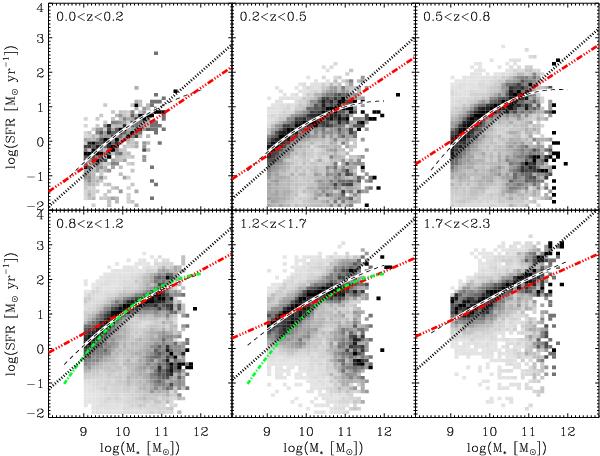
Number density of sources in the SFR− M∗ plane. Shadings are independent for each stellar mass bin, i.e., the darkest colour indicates the highest number density of sources in the stellar mass bin and not the highest number density of sources in the entire SFR− M∗ plane. Short-dashed lines on a white background show the second order polynomial function fitted to MS of star formation (see text for details). Dotted lines present the MS found in Elbaz et al. (2011). The red triple-dot-dashed lines represent the MS found in Rodighiero et al. (2010). The green dot-dashed lines in the 0.8 < z < 1.2 and 1.2 < z < 1.7 panels show the MS found in Whitaker et al. (2012) at z ~ 1.25.
Current usage metrics show cumulative count of Article Views (full-text article views including HTML views, PDF and ePub downloads, according to the available data) and Abstracts Views on Vision4Press platform.
Data correspond to usage on the plateform after 2015. The current usage metrics is available 48-96 hours after online publication and is updated daily on week days.
Initial download of the metrics may take a while.