Fig. 10
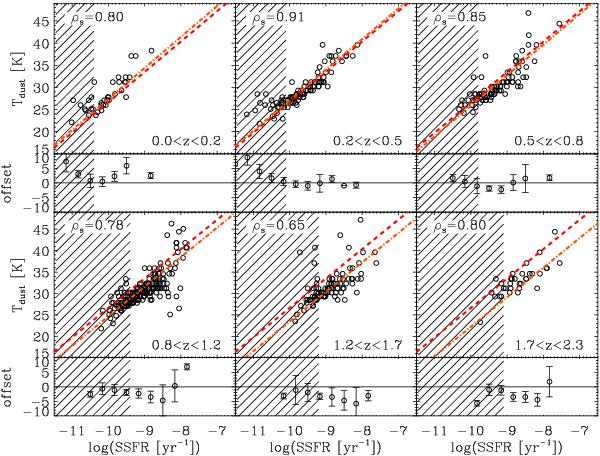
Dust temperature of galaxies as a function of SSFR, as derived from our stacking analysis. In each panel, we give the Spearman correlation factor derived from our data points. Dashed red lines correspond to a linear fit to the data points of the 0.2 < z < 0.5 redshift bin. Dot-dashed orange lines show the redshift evolution of the Tdust–SSFR relation, fixing its slope to that observed in the 0.2 < z < 0.5 redshift bin (i.e., slope of the dashed red line) and fitting its zero point with a A × (1 + z)B function (see Eq. (5)). Hatched areas represent the regions of parameter space affected by incompleteness (see text and Fig. 5). The lower panel of each redshift bin shows the offset between the median dust temperature of our data points and the dashed red line, in bins of 0.3 dex.
Current usage metrics show cumulative count of Article Views (full-text article views including HTML views, PDF and ePub downloads, according to the available data) and Abstracts Views on Vision4Press platform.
Data correspond to usage on the plateform after 2015. The current usage metrics is available 48-96 hours after online publication and is updated daily on week days.
Initial download of the metrics may take a while.