Fig. 1
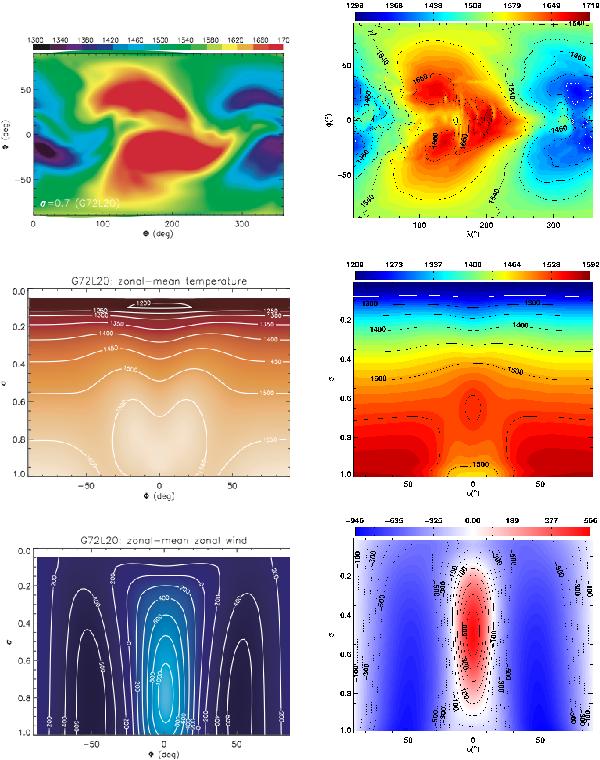
Solutions to the SHJ test case. Left panels are figures reproduced from Heng et al. (2011) using the finite-difference model (reproduced by permission of Oxford University Press), and the right panels are results from this work for the “shallow” case (see Table 1 for explanation). The top row shows the temperature field at σ = 0.675 and 346 days. The middle and bottom rows show the zonal mean plots for temperature and wind respectively (i.e. zonally and temporally, from 200–1200 days, averaged).
Current usage metrics show cumulative count of Article Views (full-text article views including HTML views, PDF and ePub downloads, according to the available data) and Abstracts Views on Vision4Press platform.
Data correspond to usage on the plateform after 2015. The current usage metrics is available 48-96 hours after online publication and is updated daily on week days.
Initial download of the metrics may take a while.