Fig. 11
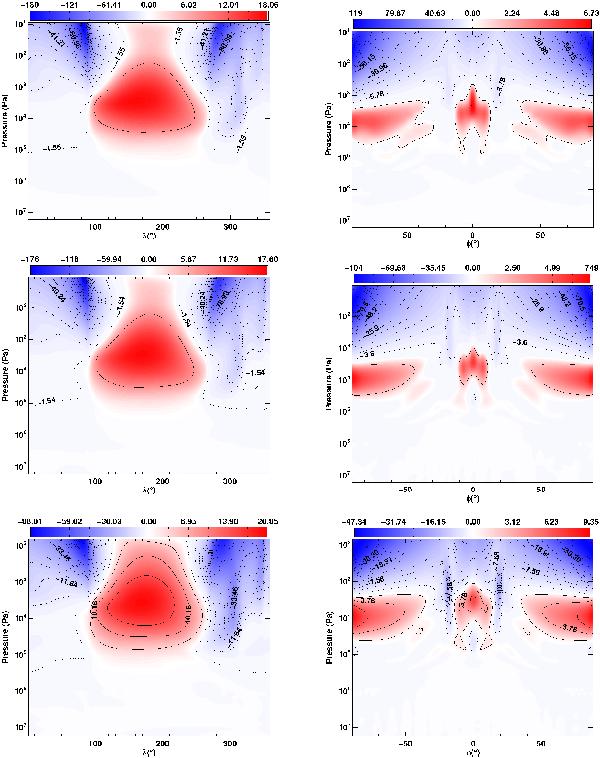
Vertical velocity, as a function of pressure, for the “shallow”, “deep” and “full” cases (see Table 1 for explanation) as the top, middle and bottom panels respectively. The left and right panels show vertical velocity as a function of longitude where a meridional average (performed in a point-wise fashion, i.e. ∫ vdφ as opposed to ∫ cosφvdφ, to emphasise differences in the vertical flow towards the polar regions) has been performed, and of latitude where a zonal average has been performed, respectively.
Current usage metrics show cumulative count of Article Views (full-text article views including HTML views, PDF and ePub downloads, according to the available data) and Abstracts Views on Vision4Press platform.
Data correspond to usage on the plateform after 2015. The current usage metrics is available 48-96 hours after online publication and is updated daily on week days.
Initial download of the metrics may take a while.