Free Access
Fig. 10
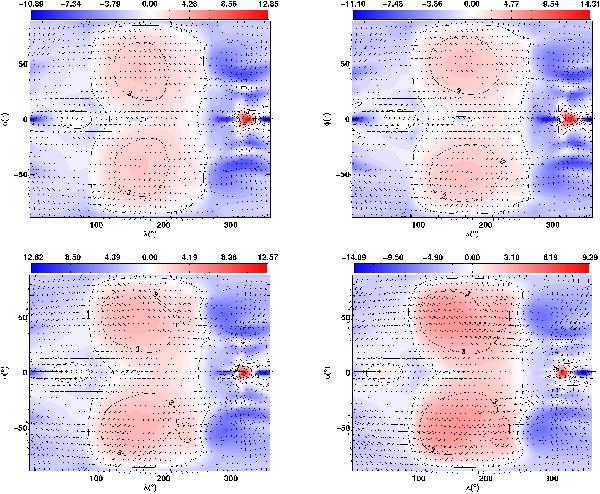
Horizontal velocity (vector arrows) and vertical velocity (colour scale) for the “full” case (see Table 1 for explanation) at 1 × 10⁵ Pa (1 bar) and after 100 (top left), 400 (top right), 800 (bottom left) and 1200 (bottom right) days. Although the colour scales differ, the contour lines are the same for all panels.
Current usage metrics show cumulative count of Article Views (full-text article views including HTML views, PDF and ePub downloads, according to the available data) and Abstracts Views on Vision4Press platform.
Data correspond to usage on the plateform after 2015. The current usage metrics is available 48-96 hours after online publication and is updated daily on week days.
Initial download of the metrics may take a while.