Fig. 5
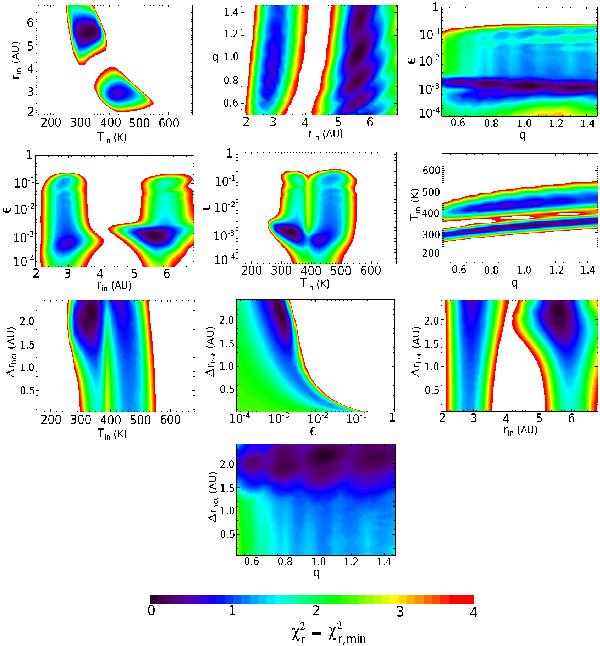
Maps of the reduced χ2 combining the SED and the visibility ( ). Here, we represent
  with respect to the free parameters of the two-component disk model as a result of the wide scan (see Table 4). These maps are shown for the high-density case. For each pair of parameters, the
  shown is the lowest value of all combinations of other parameters. The white areas correspond to
  .
.
Current usage metrics show cumulative count of Article Views (full-text article views including HTML views, PDF and ePub downloads, according to the available data) and Abstracts Views on Vision4Press platform.
Data correspond to usage on the plateform after 2015. The current usage metrics is available 48-96 hours after online publication and is updated daily on week days.
Initial download of the metrics may take a while.