Fig. 1

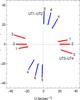
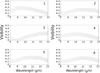
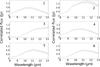
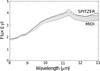
Top left: MIDI UV coverage for the two sets of observations; labels 1, 2, 3 refer to B = 49.9 m, 54.8 m and 61.2 m, and labels 4, 5, 6 refer to B = 52.4 m, 56.1 m and 55.6 m (as detailed in Table 2). Top right: measured N-band visibilities of HD 139614 (with error bars) as a function of wavelength. We indicate the label (from 1 to 6) of each interferometric observation, as defined in Table 2. Bottom left: calibrated MIDI correlated flux measurements of HD 139614. We indicate the label (from 1 to 6) of each interferometric observation as defined in Table 2. Bottom right: averaged MIDI uncorrelated spectrum and Spitzer spectrum of HD 139614 between 8 μm and 13 μm. PAH emission features are visible at 8.6 μm and 11.3 μm, as detected by Acke et al. (2010).
Current usage metrics show cumulative count of Article Views (full-text article views including HTML views, PDF and ePub downloads, according to the available data) and Abstracts Views on Vision4Press platform.
Data correspond to usage on the plateform after 2015. The current usage metrics is available 48-96 hours after online publication and is updated daily on week days.
Initial download of the metrics may take a while.