Fig. 8
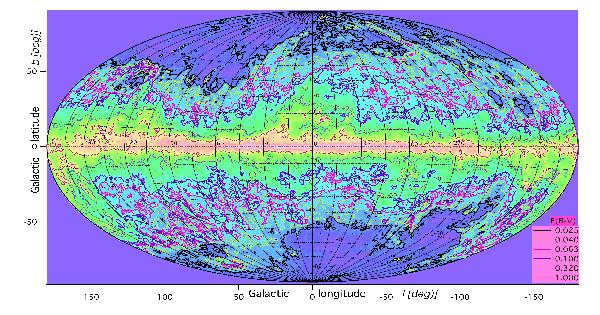
The Schlegel et al. (1998) dust map is reproduced, along with the traces of the vertical planes of Figs. 4 to 7 superimposed. The color–coded quantity is the logarithm of E(B − V). The six contours are for log (E(B − V)) = 0 (thin pink), –0.5 (thin violet), –1 (thick violet), –1.2 (thick pink), –1.4 (yellow), and –1.6 (black). Counterparts to the tenuous clouds at mid or high latitudes that appear in this SFD map can be searched for in Figs. 4 to 7, using the l,b grid.
Current usage metrics show cumulative count of Article Views (full-text article views including HTML views, PDF and ePub downloads, according to the available data) and Abstracts Views on Vision4Press platform.
Data correspond to usage on the plateform after 2015. The current usage metrics is available 48-96 hours after online publication and is updated daily on week days.
Initial download of the metrics may take a while.