Fig. 2
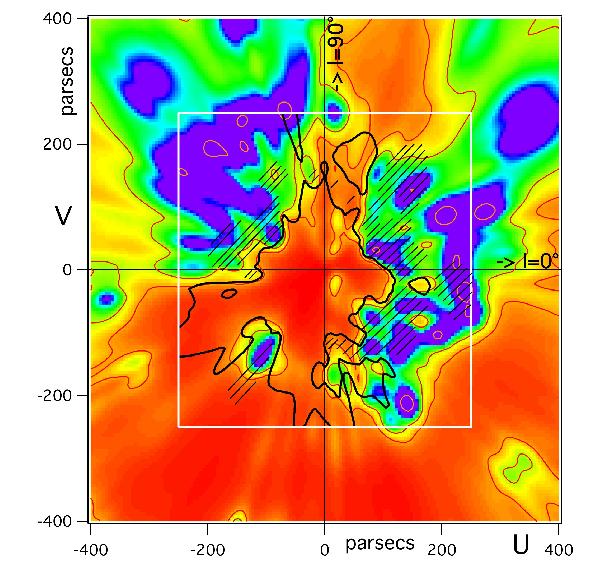
Comparison between the extended map and the 500 pc wide map from Vergely et al. (2010). The black line is an iso-contour at dE(B − V)/dr = 0.0002 mag per pc drawn from the previous 3D distribution and delimiting the Local Cavity. Hatched areas correspond to the closest dense regions revealed in those previous maps. Depending on locations, the new maps reveal the full extent of those opaque regions at larger radial distances, or their division into distinct groups of clouds that the poorer resolution did not allow distinguishing earlier.
Current usage metrics show cumulative count of Article Views (full-text article views including HTML views, PDF and ePub downloads, according to the available data) and Abstracts Views on Vision4Press platform.
Data correspond to usage on the plateform after 2015. The current usage metrics is available 48-96 hours after online publication and is updated daily on week days.
Initial download of the metrics may take a while.