Fig. 11
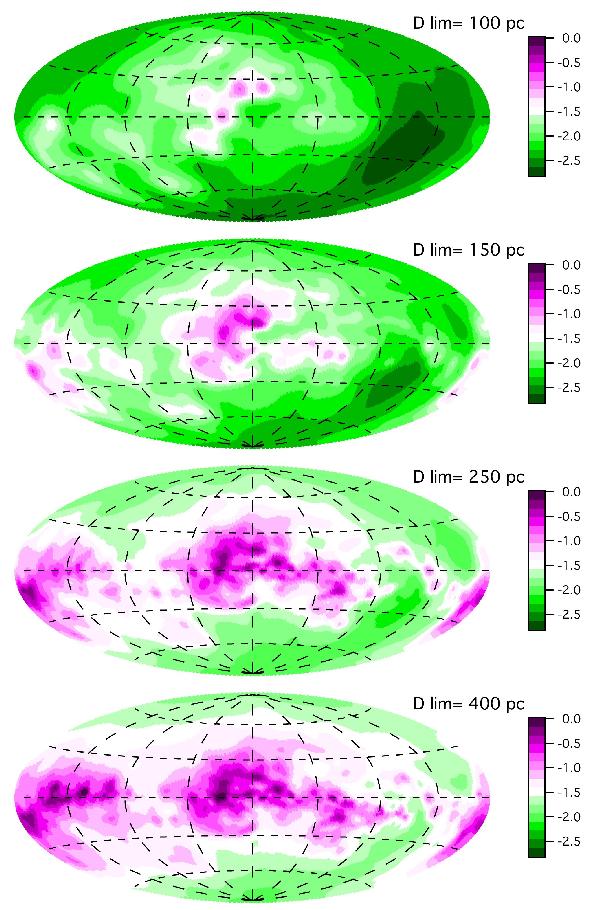
Opacity E(B − V) from the Sun to the distance Dlim = 100, 150, 250, and 400 pc, respectively (top to bottom), on a logarithmic scale. The maps are in Aitoff projections, with meridian traces for l = 45, 90, 135, 225, 270, and 315° and parallel traces for b = −60, –30, +30, and +60° shown as dashed and long-dashed lines, resp. The color scale is identical in the four maps.
Current usage metrics show cumulative count of Article Views (full-text article views including HTML views, PDF and ePub downloads, according to the available data) and Abstracts Views on Vision4Press platform.
Data correspond to usage on the plateform after 2015. The current usage metrics is available 48-96 hours after online publication and is updated daily on week days.
Initial download of the metrics may take a while.