Fig. 9
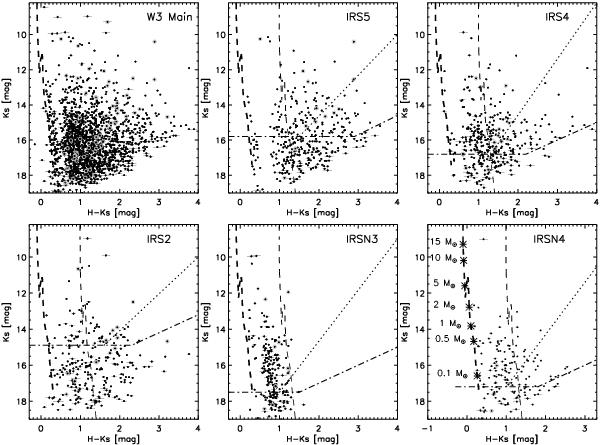
H − Ks vs. Ks color–magnitude diagram of W3 Main and the chosen subregions in W3 Main. The subregions are circular areas covering the bright Hii regions with a radius of 1′, as shown in Fig 1. The objects marked with a gray circle are identified as Ks-band excess sources using the method described in Sect. 3.4. No field subtraction has been performed in these plots. Note the different plotting range for the IRSN4 panel. Overplotted is the 2 Myr main sequence and PMS isochrone (Brott et al. 2011; Tognelli et al. 2011) for AKs= 0 mag (thick dashed line) and AKs= 1.5 mag (thin dashed line). The IRSN4 panel shows the masses indicated on the isochrone. The dash-dotted lines are 50% completeness limits for the H- and Ks-bands taken from Table 1. The dotted line represents an estimate of the completeness due to the matching with the J-band. Above this line, the JHKs matched sample occupies the CMD, below the line, only HKs matched sources are found.
Current usage metrics show cumulative count of Article Views (full-text article views including HTML views, PDF and ePub downloads, according to the available data) and Abstracts Views on Vision4Press platform.
Data correspond to usage on the plateform after 2015. The current usage metrics is available 48-96 hours after online publication and is updated daily on week days.
Initial download of the metrics may take a while.