Fig. 3
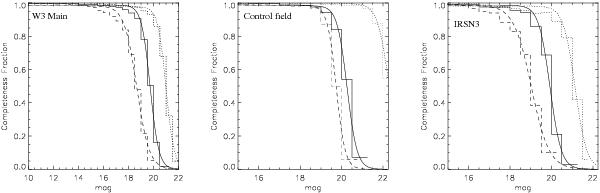
Fraction of the photometric completeness as a function of the observed magnitude in W3 Main (left), the control field (middle) and the IRSN3 subregion of W3 Main (right). The dashed lines show the average completeness fraction for the Ks-band, the solid lines the H-band and the dotted lines shows the J-band completeness fraction. The resulting average 50% completeness limits are given in Table 1.
Current usage metrics show cumulative count of Article Views (full-text article views including HTML views, PDF and ePub downloads, according to the available data) and Abstracts Views on Vision4Press platform.
Data correspond to usage on the plateform after 2015. The current usage metrics is available 48-96 hours after online publication and is updated daily on week days.
Initial download of the metrics may take a while.