Fig. 1
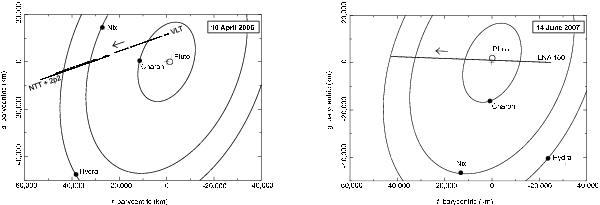
Left: geometry of the April 10, 2006 Pluto stellar appulse. The stellar tracks as seen from VLT (Paranal) and NTT, 2p2 telescopes (La Silla) are shown relative to the Pluto-Charon barycenter (the cross at origin). The quantity f (resp. g) on the horizontal (resp. vertical) axis is the offset relative to the Pluto-Charon barycenter in the plane of the sky, counted positively toward the local celestial J2000 east (resp. north). The arrow indicates the direction of stellar motion. Note the interruptions in the observations (Table 1). Pluto’s body is shown as a circle next to the cross, and the satellites positions are shown at 6:00 UT, the approximate mid-time of observations. A close-up view of the stellar tracks as seen from VLT, NTT and 2p2 are shown in Fig. 2. Right: geometry of the June 14, 2007 Pluto occultation, as seen from the LNA160 telescope. Symbols are the same as for the left panel. The satellites are shown at 01:30 UT, the approximate mid-time of observations. All the satellite positions are derived from the orbital solution of Tholen et al. (2008).
Current usage metrics show cumulative count of Article Views (full-text article views including HTML views, PDF and ePub downloads, according to the available data) and Abstracts Views on Vision4Press platform.
Data correspond to usage on the plateform after 2015. The current usage metrics is available 48-96 hours after online publication and is updated daily on week days.
Initial download of the metrics may take a while.