Fig. 6
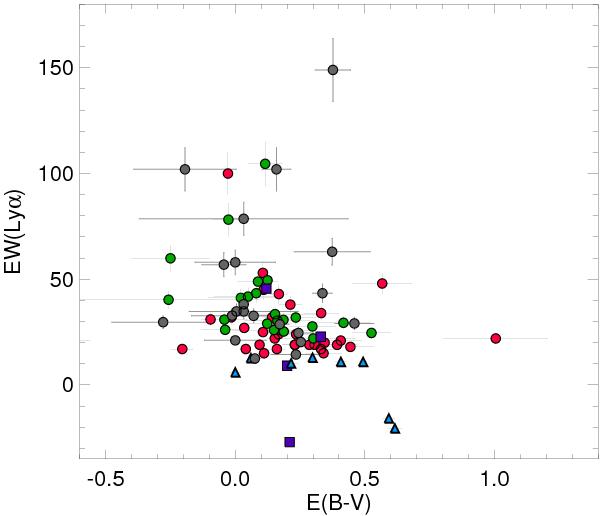
Lyα equivalent width as a function of the gas-phase dust extinction. Black circles are the GALEX Lyα emitters, and green and red circles are the other GALEX samples of Scarlata et al. (2009) and Cowie et al. (2011), respectively. The blue triangles represent the IUE spectroscopic sample, and purple squares local starbursts from Atek et al. (2008).
Current usage metrics show cumulative count of Article Views (full-text article views including HTML views, PDF and ePub downloads, according to the available data) and Abstracts Views on Vision4Press platform.
Data correspond to usage on the plateform after 2015. The current usage metrics is available 48-96 hours after online publication and is updated daily on week days.
Initial download of the metrics may take a while.