Fig. 4
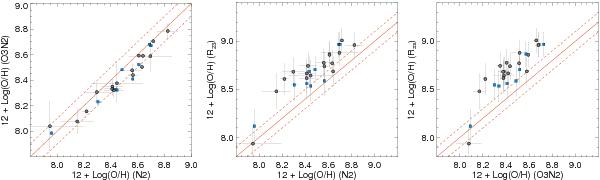
Comparison between the various oxygen-abundance-derived indicators: R23 = ([Oii] λ3727 + [Oiii] λλ 4959, 5007)/Hβ (Pagel et al. 1979), N2 = log ([Nii]λ6583/Hα) and O3N2 = log {([Oiii] λ5007/Hβ)/([Nii] λ 6583/Hα)} (Pettini & Pagel 2004). The z ~ 0.3 galaxies are shown with black circles and the local galaxies with blue squares with 1σ error bars. The solid line represents the 1:1 ratio with ±0.1 dex uncertainties (dashed lines). Some galaxies are not present in all the plots because the corresponding diagnostic lines were not detected with sufficient significance.
Current usage metrics show cumulative count of Article Views (full-text article views including HTML views, PDF and ePub downloads, according to the available data) and Abstracts Views on Vision4Press platform.
Data correspond to usage on the plateform after 2015. The current usage metrics is available 48-96 hours after online publication and is updated daily on week days.
Initial download of the metrics may take a while.