Fig. 3
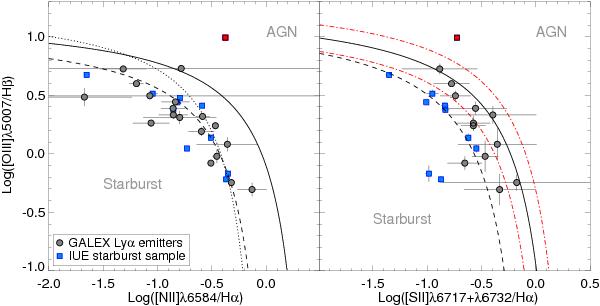
BPT diagrams used to classify narrow emission-line galaxies. GALEX Lyα emitters are represented with black circles with corresponding error bars, together with an IUE sample of local starburst galaxies in blue squares. The left panel shows [Oiii] λ5007/Hβ versus [Nii] λ6584/Hα ratios. The dashed and solid curves are theoretical boundaries separating starbursts and AGN objects assuming an instantaneous burst (Dopita et al. 2000) and an extended star formation episode (Kewley et al. 2001), respectively. The dotted curve is the “Kauffmann line” (Kauffmann et al. 2003). The right panel represents the [Oiii] λ5007/Hβ versus [Sii] (λ6717 + 6732)/Hα diagnostic with the same theoretical models as in the right panel. The red dot-dashed line shows typical model uncertainties of ± 0.1 dex. The diagram includes all the 11 IUE local galaxies, among which is an object previously classified as an AGN (red square) that we decided to show as an example.
Current usage metrics show cumulative count of Article Views (full-text article views including HTML views, PDF and ePub downloads, according to the available data) and Abstracts Views on Vision4Press platform.
Data correspond to usage on the plateform after 2015. The current usage metrics is available 48-96 hours after online publication and is updated daily on week days.
Initial download of the metrics may take a while.