Fig. 12
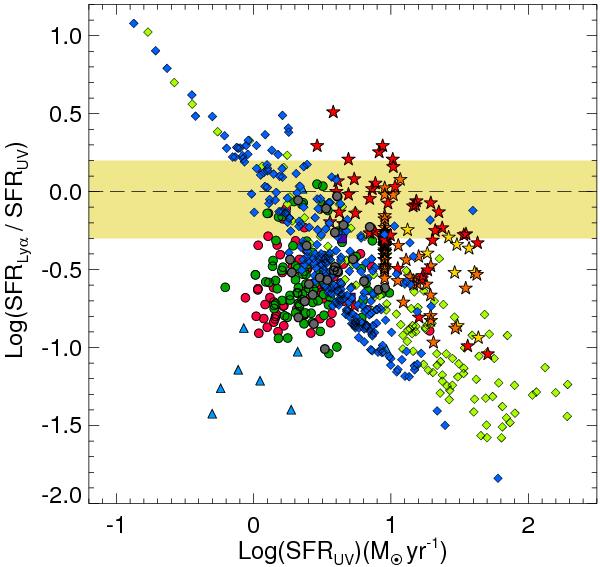
SFR(Lyα) to SFR(UV) ratio as a function of SFR(UV). The color code for the local sample is the same as in previous figures. Several high-z samples are also included: green and blue diamonds (Gronwall et al. 2007; Guaita et al. 2010); yellow, orange, and red stars (Curtis-Lake et al. 2012; Taniguchi et al. 2005; Jiang et al. 2013). The SFRs are observed values not corrected for dust extinction.The dashed line corresponds to the SFR ratio of unity. The yellow region denotes the SFR ratio values that would be derived for different star formation histories (see text for details).
Current usage metrics show cumulative count of Article Views (full-text article views including HTML views, PDF and ePub downloads, according to the available data) and Abstracts Views on Vision4Press platform.
Data correspond to usage on the plateform after 2015. The current usage metrics is available 48-96 hours after online publication and is updated daily on week days.
Initial download of the metrics may take a while.