Fig. 11
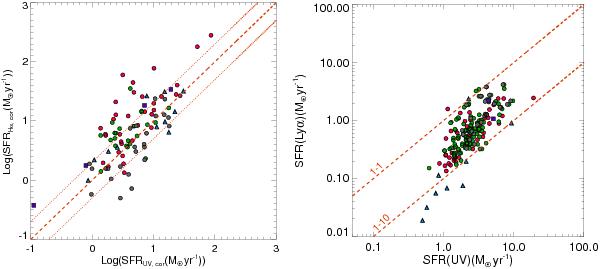
Comparison between SFR indicators. The SFR values are calculated using Kennicutt (1998) calibration. The left panel shows SFR(Hα) versus SFR(UV) both corrected for dust extinction derived from the Balmer decrement. The dashed line denotes the line of equality, while the dotted lines have a factor-of-2 deviation. The right panel presents the observed SFR(Lyα) as a function of SFR(UV), with no correction for dust extinction. The two dashed lines mark the 1:1 and 1:10 ratios for SFRLyα:SFRUV. The symbols are the same as in Fig. 10.
Current usage metrics show cumulative count of Article Views (full-text article views including HTML views, PDF and ePub downloads, according to the available data) and Abstracts Views on Vision4Press platform.
Data correspond to usage on the plateform after 2015. The current usage metrics is available 48-96 hours after online publication and is updated daily on week days.
Initial download of the metrics may take a while.