Fig. 10
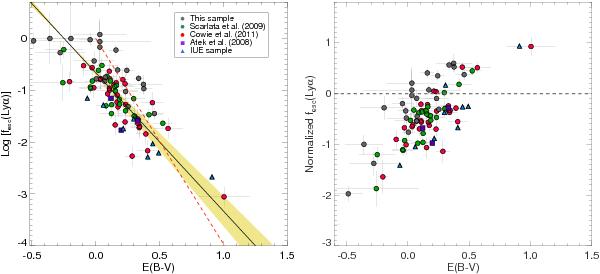
Lyα escape fraction as a function of the nebular dust extinction. The figure shows the z ~ 0.3 Lyα emitters of this work with black circles. We also derived fesc(Lyα) for other galaxy samples: z ~ 0 IUE sample represented by blue triangles, z ~ 0.3 sample of Scarlata et al. (2009) with green circles, Cowie et al. (2011) sample with red circles, z ~ 0 galaxies of Atek et al. (2008) with purple squares. Note that the negative values of E(B − V) are shown in the plot but were assigned E(B − V) = 0 before fesc(Lyα) calculation or fitting the fesc–E(B − V) relationship. The left panel shows fesc(Lyα) as a function of E(B − V) assuming a Cardelli et al. (1989) extinction law. The solid black line denotes the best 2-parameter fit to the relationship with both the slope and the intercept as free parameters. The yellow region covers the 1σ uncertainties of the fit derived from MC simulations. The dashed red line is the expected attenuation law at the Lyα wavelength. In the right panel we plot the normalized escape fraction fesc,rel(Lyα) = log [fesc(Lyα)/fesc(cont)] as a function of extinction. The normalized escape fraction represents the deviation of fesc(Lyα) from the classical dust attenuation law at 1216 Å. The color code for the samples is the same as in the left panel.
Current usage metrics show cumulative count of Article Views (full-text article views including HTML views, PDF and ePub downloads, according to the available data) and Abstracts Views on Vision4Press platform.
Data correspond to usage on the plateform after 2015. The current usage metrics is available 48-96 hours after online publication and is updated daily on week days.
Initial download of the metrics may take a while.