Fig. 10
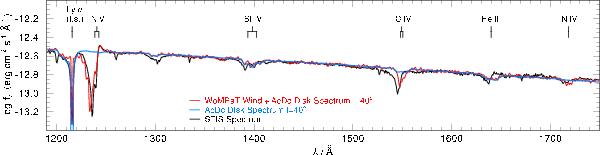
HST/STIS spectrum of AM CVn (black), disk spectrum (blue), and wind spectrum (red, Twind = 35 000 K, Ṁwind = 5 × 10⁻¹⁰ M⊙ yr-1, SV model). Note the prominent P Cygni profile of the N v 1240 Å line is not similar to that of the disk, but to that of the wind model. All models are reddened by E(B − V) = 0.12, and folded with a 1.2 Å Gaussian.
Current usage metrics show cumulative count of Article Views (full-text article views including HTML views, PDF and ePub downloads, according to the available data) and Abstracts Views on Vision4Press platform.
Data correspond to usage on the plateform after 2015. The current usage metrics is available 48-96 hours after online publication and is updated daily on week days.
Initial download of the metrics may take a while.