| Issue |
A&A
Volume 561, January 2014
|
|
|---|---|---|
| Article Number | A137 | |
| Number of page(s) | 9 | |
| Section | Stellar structure and evolution | |
| DOI | https://doi.org/10.1051/0004-6361/201321408 | |
| Published online | 24 January 2014 | |
Disc-loss episode in the Be shell optical counterpart to the high-mass X-ray binary IGR J21343+4738⋆
1 IESL, Foundation for Reseach and Technology-Hellas, 71110 Heraklion, Greece
e-mail: This email address is being protected from spambots. You need JavaScript enabled to view it.
2 Physics Department, University of Crete, 71003 Heraklion, Greece
3 Harvard-Smithsonian Center for Astrophysics, 60 Garden Street, Cambridge MA02138, USA
Received: 5 March 2013
Accepted: 3 November 2013
Abstract
Context. Present X-ray missions are regularly discovering new X-ray and γ-ray sources. The identification of their counterparts at other wavelengths allows us to determine their nature.
Aims. The main goal of this work is to determine the properties of the optical counterpart to the INTEGRAL source IGR J21343+4738, and to study its long-term optical variability. Although its nature as a Be/X-ray binary has been suggested, little is known about its physical parameters.
Methods. We have been monitoring IGR J21343+4738 since 2009 in the optical band. We present BVRI optical photometric and spectroscopic observations covering the wavelength band 4000–7500 Å. The photometric data allowed us to derive the colour excess E(B − V) and estimate the distance. The blue-end spectra were used to determine the spectral type of the optical companion, while the spectra around the Hα line allowed us to study the long-term structural changes in the circumstellar disc.
Results. We find that the optical counterpart to IGR J21343+4738 is a V = 14.1 B1IVe shell star located at a distance of ~8.5 kpc. The Hα line changed from an absorption-dominated profile to an emission-dominated profile, and then back again into absorption. In addition, fast line profile asymmetries were observed once the disc developed. Although the Balmer lines are the most strongly affected by shell absorption, we find that shell characteristics are also observed in He I lines.
Conclusions. The optical spectral variability of IGR J21343+4738 is attributed to the formation of an equatorial disc around the Be star and the development of an enhanced density perturbation that revolves inside the disc. We have witnessed the formation and dissipation of the circumstellar disc. The strong shell profile of the Hα and He I lines and the fact that no transition from the shell phase to a pure emission phase is observed imply that we are seeing the system near edge-on.
Key words: stars: individual: IGR J21343+4738 / X-rays: binaries / stars: neutron / stars: emission-line, Be
The reduced spectra are available as FITS files at the CDS via anonymous ftp to cdsarc.u-strasbg.fr (130.79.128.5) or via http://cdsarc.u-strasbg.fr/viz-bin/qcat?J/A+A/561/A137
© ESO, 2014
1. Introduction
The first report of a detection of IGR J21343+4738 in the hard X-ray band is found in the INTEGRAL/IBIS all-sky survey catalogues, which are based on data taken before the end of 2006 (Krivonos et al. 2007; Bird et al. 2007). At that time, it was known only as a transient source that had been detected during a series of observations between December 2002 and February 2004 and was below the threshold of the INTEGRAL detectors between 2004–2007 (Bikmaev et al. 2008). A Chandra observation was performed on 18 December 2006, during the off state of the INTEGRAL instruments. However, a weak source consistent with the position of IGR J21343+4738 was detected. The Chandra observation allowed the refinement of its X-ray position and the suggestion of an optical counterpart (Sazonov et al. 2008). Low-resolution (FWHM ~ 15 Å) optical spectroscopic observations of the likely counterpart indicated a B3 star (Bikmaev et al. 2008). Although the Hα line was found in absorption, it was proposed that IGR J21343+4738 was a high-mass X-ray binary with a Be star companion. It was argued that the star was going through a disc-loss episode at the time of the observations. About one year after Bikmaev et al. (2008) observations, the Hα line was observed with an emission profile, suggesting the presence of a circumstellar disc (Masetti et al. 2009).
Be/X-ray binaries (BeXB) are a class of high-mass X-ray binaries that consist of a Be star and a neutron star (Reig 2011). The mass donor in these systems is a relatively massive (≳10 M⊙) and fast-rotating (≳80% of break-up velocity) star, whose equator is surrounded by a disc formed from photospheric plasma ejected by the star; Hα in emission is typically the dominant feature in the spectra of these stars. The strength of the Balmer lines in general and of Hα in particular (whether it has ever been in emission) together with a luminosity class III-V constitute the defining properties of this class of objects. The equatorial discs are believed to be quasi-Keplerian and supported by viscosity (Okazaki 2001). The shape and strength of the spectral emission lines are useful indicators of the state of the disc. Global disc variations include the transition from a Be phase, i.e. when the disc is present, to a normal B star phase, i.e. when the disc is absent and also cyclic V/R changes, i.e. variation in the ratio of the blue to red peaks of a split profile that are attributed to the precession of a density perturbation inside the disc (Okazaki 1991; Papaloizou & Savonije 2006).
Photometric measurements of the optical counterpart to IGR J21343+4738.
In this work we present the first long-term study of the optical counterpart to the X-ray source IGR J21343+4738 and report a disc-loss episode. The absence of the disc allows us to derive some of the fundamental physical parameters such as reddening, distance, and rotation velocity, without contamination from the disc. We also confirm that IGR J21343+4738 is a BeXB, although with an earlier spectral type than the one suggested by Bikmaev et al. (2008).
2. Observations
Optical spectroscopic and photometric observations of the optical counterpart to the INTEGRAL source IGR J21343+4738 were obtained from the 1.3m telescope of the Skinakas observatory (SKO) on the island of Crete (Greece) and from the Fred Lawrence Whipple Observatory (FLWO) at Mt. Hopkins (Arizona). In addition, IGR J21343+4738 was observed in service time with the 4.2 m William Herschel Telescope (WHT) at the El Roque de los Muchachos observatory in La Palma (Spain).
The 1.3 m telescope at the Skinakas Observatory was equipped with a 2000 × 800 ISA SITe CCD and a 1302 l mm-1 grating, giving a nominal dispersion of ~1.04 Å/pixel. On the nights of 29 September 2009 and 6 September 2011, a 2400 l mm-1 grating with a dispersion of ~0.46 Å/pixel was used. We also observed IGR J21343+4738 in queue mode with the 1.5 m telescope at Mt. Hopkins (Arizona), and the FAST-II spectrograph (Fabricant et al. 1998) plus FAST3 CCD, a backside-illuminated 2688 × 512 UA STA520A chip with 15 μm pixels and a 1200 l mm-1 grating (0.38 Å/pixel). The WHT spectra were obtained in service mode on the nights of 26 December 2012 and 23 August 2013 with the ISIS spectrograph and the R1200B grating plus the EEV12 4096 × 2048 13.5 μm pixel CCD (0.22 Å/pixel) for the blue arm and the R1200R grating and REDPLUS 4096 × 2048 15 μm pixel CCD (0.25 Å/pixel) for the red arm. The spectra were reduced with the dedicated packages for spectroscopy of the STARLINK and IRAF projects following the standard procedure. In particular, the FAST spectra were reduced with the FAST pipeline (Tokarz & Roll 1997). The images were bias subtracted and flat-field corrected. Spectra of comparison lamps were taken before each exposure to account for small variations of the wavelength calibration during the night. Finally, the spectra were extracted from an aperture encompassing more than 90% of the flux of the object. Sky subtraction was performed by measuring the sky spectrum from an adjacent object-free region. To ensure the homogeneous processing of the spectra, they were normalized with respect to the local continuum, which was rectified to unity by employing a spline fit.
Log of the spectroscopic observations around the Hα line and results from the spectral analysis.
The photometric observations were made from the 1.3 m telescope of the Skinakas Observatory. The source IGR J21343+4738 was observed through the Johnson/Bessel B, V, R, and I filters (Bessell 1990). For the photometric observations the telescope was equipped with a 2048 × 2048 ANDOR CCD with a 13.5 μm pixel size (corresponding to 0.28 arcsec on the sky) and thus provides a field of view of 9.5 arcmin × 9.5 arcmin. The gain and read out noise of the CCD camera at a read-out velocity of 2 μs/pixel are 2.7 e−/ADU and 8 e−, respectively. The FWHM (seeing estimate) of the point sources in the images varied from 4 to 6 pixels (1.1′′–1.7′′) during the different campaigns. Reduction of the data was carried out in the standard way using the IRAF tools for aperture photometry. First, all images were bias-frame subtracted and flat-field corrected using twilight sky flats to correct for pixel-to-pixel variations on the chip. The resulting images are therefore free from the instrumental effects. All the light inside an aperture with radius 4.5′′ was summed up to produce the instrumental magnitudes. The sky background was determined as the statistical mode of the counts inside an annulus 5 pixels wide and 20 pixels from the centre of the object. The absorption caused by the Earth’s atmosphere was taken into account by nightly extinction corrections determined from measurements of selected stars that also served as standards. Finally, the photometry was accurately corrected for colour equations and transformed to the standard system using nightly observations of standard stars from Landolt’s catalogue (Landolt 1992, 2009). The error of the photometry was calculated as the root mean square of the difference between the derived final calibrated magnitudes of the standard stars and the magnitudes of the catalogue.
The photometric magnitudes are given in Table 1, while information about the spectroscopic observations can be found in Tables 2 and 3.
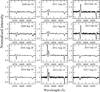 |
Fig. 1 Evolution of the Hα and He I 6678 Å lines. Absorption by the disc along the line of sight produces very narrow lines (shell profiles). |
3. Results
3.1. The Hα line: evolution of spectral parameters
The Hα line is the most important indicator of the circumstellar disc state. In particular, its equivalent width (EW(Hα)) provides a good measure of the size of the circumstellar disc (Quirrenbach et al. 1997; Tycner et al. 2005; Grundstrom & Gies 2006). The Hα emission results from the recombination of photoionised electrons by the optical and UV radiation from the central star. Thus, in the absence of the disc, no emission should be observed and the line should display an absorption profile. The Hα line of the massive companion in IGR J21343+4738 is highly variable, both in strength and shape. When the line appears in emission it always shows a double-peaked profile, but the relative intensity of the blue (V) over the red (R) peaks varies. The central absorption that separates the two peaks goes beyond the continuum, placing IGR J21343+4738 in the group of the so-called shell stars (Hanuschik 1995, 1996; Hummel & Vrancken 2000; Rivinius et al. 2006). Figure 1 displays the evolution of the line profiles. The V/R variability is clearly seen, indicating a distorted disc (Hummel & Hanuschik 1997). Significant changes in the structure of the equatorial disc on timescales of months are observed. In addition, a long-term growth/dissipation of the disc is suggested by the increase of the equivalent width and subsequent decrease.
Table 2 gives the log of the spectroscopic observations and some important parameters that resulted from fitting Gaussian functions to the Hα line profile. Owing to the deep central absorption, three Gaussian components (two in emission and one in absorption) were generally needed to obtain good fits. Column 5 gives the equivalent width of the entire Hα line (i.e. including all components). The main source of uncertainty in the equivalent width stems from the always difficult definition of the continuum. The EW(Hα) given in Table 2 correspond to the average of twelve measurements, each one from a different definition of the continuum, and the quoted error is the scatter (standard deviation) present in those twelve measurements.
Log of the spectroscopic observations in the blue region.
Column 6 shows the ratio between the core intensity of the blue and red humps. The V/R ratio is computed as the logarithm of the ratio of the relative fluxes at the blue and red emission peak maxima. Thus, negative values indicate a red-dominated peak, i.e. V < R, and positive values a blue-dominated line, V > R.
Columns 7 and 8 in Table 2 give the ratio of the peak flux of each component over the minimum flux of the deep absorption core. This ratio simply serves to confirm the shell nature of IGR J21343+4738 in a more quantitative way. Hanuschik (1996) established an empirical shell criterion based on the Hα line whereby shell stars are those with Fp/Fcd ≳ 1.5, where Fp and Fcd are the mean peak and trough flux, respectively.
Column 9 is the velocity shift of the central narrow absorption shell feature when the disc is present, or of the absorption profile of the Hα line in the absence of the disc. Prior to the measurement of the velocity shift, all the spectra were aligned taking the value of the insterstellar line at 6612.8 Å as reference. We note that these shifts do not necessarily represent the radial velocity of the binary, because the Hα line is strongly affected by circumstellar matter (see e.g. Harmanec 2003, for a discussion of the various effects when circumstellar matter is present in the system). Typically, the He I lines in the blue end of the spectrum are used for radial velocity studies. We note, however, that in IGR J21343+4738, even these lines are affected by disc emission (see Sect. 3.3). Nevertheless, we measured the radial velocity of the binary by cross-correlating the higher resolution blue-end spectra obtained from the FLWO and WHT (Table 3) with a template using the fxcor task in the IRAF package. This template was generated from the BSTAR2006 grid of synthetic spectra (Lanz & Hubeny 2007) and correspond to a model atmosphere with Teff = 25 000 K, log g = 3.75 convolved by a rotational profile with vsini = 380 km s-1. The results for the July and August 2013 observations, when the contribution of the disc was expected to be minimum, are vr = −127 ± 30 km s-1 (HJD 2 456 488.863) and vr = −120 ± 10 km s-1 (HJD 2 456 528.582), respectively.
Figure 2 shows the evolution of EW(Hα), the V/R ratio, the V magnitude, the (B − V) colour, and the velocity shift with time. In the top panel of this figure, different symbols represent the equivalent width of the different components of the line. Open circles give the sum of the equivalent widths of the individual V and R peaks, while the squares are the equivalent width of the deep central absorption. These values were obtained from the Gaussian fits. The overall equivalent widths (filled circles) were measured directly from the spectra. In the bottom panel of Fig. 2, open symbols correspond to the velocity shifts measured from the Hα line, while filled symbols are radial velocities obtained by cross-correlating the 3950–4500 Å spectra with the template. Black circles denote SKO spectra, blue triangles correspond to data taken from the FLWO, and red diamonds spectra obtained with the WHT.
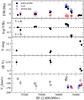 |
Fig. 2 From top to bottom, evolution of the Hα equivalent width, V/R ratio, V magnitude, (B − V) colour, and velocity shift with time. |
3.2. Spectral classification
Figure 3 shows the average blue spectrum of IGR J21343+4738 obtained with the 4.2 m WHT on the night of 23 August 2013. The main spectral features have been identified. The 3900–4600 Å spectrum is dominated by hydrogen and neutral helium absorption lines, clearly indicating an early-type B star. The earliest classes (B0 and B0.5) can be ruled out because no ionised helium is present. However, Si iii 4552-68-75 is clearly detected, favouring a spectral type of B1-B1.5. The relative weakness of Mg ii at 4481 Å also indicates a spectral type earlier than B2. The strength of the C iii+O ii blend at 4070 Å and 4650 Å agrees with this range (B1–B2) and suggests an evolved star. A subgiant or giant star, i.e. luminosity class IV or III, is also favoured by the presence of O ii at 4415-17 Å. However, in this case, the triplet Si iii 4552-68-75 Å and Si iv 4089 Å should be stronger than observed. We conclude that the spectral type of the optical counterpart to IGR J21343+4738 is in the range B1–B1.5 V–III, with a prefered classification of B1IV.
3.3. Contribution of the disc to the spectral lines and colours
Figure 4 shows a comparison of two blue-end spectra of IGR J21343+4738 taken from the FLWO at two different epochs. The October 2012 spectrum corresponds to a Be phase when the Hα line was strongly in emission, while the July 2013 spectrum corresponds to a B phase when this line displayed an absorption profile. One of the most striking results that can be directly derived from the visual comparison of the spectra is the significantly narrower width of the spectral lines, particularly those of the Balmer series and the He I lines, when the disc is present. To estimate the contribution of the disc to the width of the lines, we measured the FWHM of the He i at 6678 Å (Fig. 1) as a function of time. The result can be seen in Fig. 5, where the evolution of EW(Hα) with time is also plotted. The width of the helium line was significantly narrower and the core deeper during the strong shell phase (spectra taken during 2012, MJD ~ 56 100–56 200) than at instances where the disc was weak (in 2009 and 2013).
The disc emission also affects the photometric magnitudes and colours. The observed (B − V) colour when the disc was present (observation taken in 2011) is 0.05 mag larger than during 2013 when the disc disappeared. That is, the disc introduces an extra reddening component.
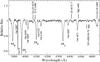 |
Fig. 3 WHT spectrum of IGR J21343+4738 and identified lines used for spectral classification. The spectrum was smoothed with a Gaussian filter (FWHM = 1). |
3.4. The He I lines: rotational velocity
Shell stars are Be stars with strongly rotationally broadened photospheric emission lines with a deep absorption core (Rivinius et al. 2006). The rotational velocity is believed to be a crucial parameter in the formation of the circumstellar disc. A rotational velocity close to the break-up or critical velocity (i.e. the velocity at which centrifugal forces balance Newtonian gravity) reduces the effective equatorial gravity to the extent that weak processes such as gas pressure and/or non-radial pulsations may trigger the ejection of photospheric matter with sufficient energy and angular momentum to make it spin up into a Keplerian disc. Because stellar absorption lines in Be stars are rotationally broadened, their widths can be used to estimate the projected rotational velocity, vsini, where v is the equatorial rotational velocity and i the inclination angle toward the observer. However, to obtain a reliable measurement of the rotational velocity of the Be star companion the He I lines have to be free of disc emission. As shown in the previous section, the width of the line becomes narrower as the disc grows, underestimating the value of the rotational velocity.
We estimated the projected rotational velocity of IGR J21343+4738 by measuring the FWHM of He I lines, following the calibration by Steele et al. (1999). These authors used four neutral helium lines, namely 4026 Å, 4143 Å, 4387 Å, and 4471 Å, to derive rotational velocities. We measured the width of these lines from the August 2013 WHT spectrum as it provides the highest resolution in our sample and corresponds to a disc-loss phase, as indicated by the absorption profile of the Hα line. We made five different selections of the continuum and fitted Gaussian profiles to these lines. We also corrected the lines for instrumental broadening by subtracting in quadrature the FWHM of a nearby line from the calibrated spectra. The projected rotational velocity obtained as the average of the values from the four He I lines was vsini = 365 ± 15 km s-1. The quoted errors are the standard deviation of all the measurements.
The rotational velocity can also be estimated by comparing the high-resolution August 2013 WHT spectrum with a grid of synthetic spectra broadened at various values of the rotational velocity. We employed the BSTAR2006 grid (Lanz & Hubeny 2007), which uses the code TLUSTY (Hubeny 1988; Hubeny & Lanz 1992; Hubeny et al. 1994) to create the model atmosphere and SYNSPEC1 to calculate the emergent spectrum. We assumed a model atmosphere with solar composition, Teff = 25 000 K and log g = 3.50 and a microturbulent velocity of 2 km s-1. This spectrum was convolved with rotational and intrumental (Gaussian) profiles using ROTIN3. Thirteen rotational velocities from 300 km s-1 to 420 km s-1 with steps of 10 km s-1 were considered. The rotational velocity that minimises the sum of the squares of the difference between data and model corresponded to vsini = 380 km s-1, consistent with the previous value.
3.5. Reddening and distance
To estimate the distance, the amount of reddening to the source has to be determined. In a Be star, the total measured reddening is made up of two components: one produced mainly by dust in the interstellar space through the line of sight and another produced by the circumstellar gas around the Be star (Dachs et al. 1988; Fabregat & Reglero 1990). Although the physical origin and wavelength dependence of these two reddenings is completely different, their final effect upon the colours is very difficult to disentangle (Torrejón et al. 2007). Interstellar reddening is caused by absorption and scattering processes, while circumstellar reddening is due to extra-emission at longer wavelenths. The disc-loss episode observed in IGR J21343+4738 allows us to derive the true magnitudes and colours of the underlying Be star without the contribution of the disc. Thus, the total reddening measured during a disc-loss episode corresponds entirely to interstellar extinction.
The observed colour of IGR J21343+4738 in the absence of the disc is (B − V) = 0.50 ± 0.02 (Table 1), while the expected colour for a B1–1.5V–IV star is (B − V)0 = −0.26 (Johnson 1966; Fitzgerald 1970; Gutierrez-Moreno 1979; Wegner 1994). Thus, we derive a colour excess of E(B − V) = 0.76 ± 0.02 or visual extinction AV = R × E(B − V) = 2.4 ± 0.1, where the standard extinction law R = 3.1 was assumed. Taking an average absolute magnitude of MV = −3.0, typical of a star of this spectral type (Humphreys & McElroy 1984; Wegner 2006), the distance to IGR J21343+4738 is estimated to be 8.7 ± 1.3 kpc. The final error was obtained by propagating the errors of B − V (0.02 mag), AV (0.1 mag), and MV (0.3 mag).
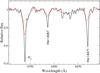 |
Fig. 4 Comparison of two spectra of IGR J21343+4738 at different epochs, when the disc was present (solid black line) and when the disc presumably had vanished (dashed red line). The spectra were taken from the FLWO on 15 October 2012 and 15 July 2013, respectively. |
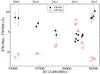 |
Fig. 5 Evolution of the FWHM of the He I λ6678 line. Note the progressive narrowing of the line as the shell phase develops and the large values when EW(Hα) is positive (interpreted as the absence of the disc). |
4. Discussion
We have investigated the long-term variability of the optical counterpart to the X-ray source IGR J21343+4738. We confirm the Be nature of IGR J21343+4738, but suggest an earlier type companion than previously suggested (Bikmaev et al. 2008; Masetti et al. 2009). Our spectral classification agrees with the spectral type distribution of BeXBs in the Milky Way; all spectroscopically identified optical companions of BeXBs in the Galaxy do not have spectral type later than B2 (Negueruela 1998).
4.1. Spectral evolution and variability time scales
Our monitoring of IGR J21343+4738 reveals large amplitude changes in the shape and strength of the spectral lines and two different time scales associated with the variability of the disc: disc formation/dissipation is estimated to occur on time scales of years, while V/R variability is seen on time scales of months.
Our first observation was performed in July 2009 and shows the contribution of a weak disc. Although the EW(Hα) is positive, indicating that absorption dominates over emission, its value is smaller than that expected from a pure photospheric line which, according to Jaschek & Jaschek (1987), should be ~3.5–4 Å. In addition, the two peaks, V and R, separated by the central depression can already be distinguished in our first spectrum. The strength of the Hα line increased and its shape changed from an absorption dominated profile into an emission dominated one during the period July 2009–September 2012. As the intensity increased, the line became progressively more asymmetric. After September 2012, EW(Hα) began to decrease more quickly than it increased. By June 2013, the Hα line profile had turned into absorption, that is, the system entered a disc-loss episode.
Owing to the observational gaps, the overall time scale for the formation and dissipation of the circumstellar disc is difficult to determine. The observations of IGR J21343+4738 by Bikmaev et al. (2008) were made in Spring 2007 (low resolution) and Autumn2 2007 (high resolution) and show the Hα line in absorption, although in the high-resolution spectrum the shape of the line is reminiscent of a shell profile, i.e. with the contribution of a small disc. A well-developed disc was present in May 2008 when EW(Hα) = −8 Å was measured (Masetti et al. 2009). If the 2007 spectra really showed an absorption profile similar to our 2010–11 observations, then we can estimate the formation/dissipation cycle to be between 4 and 5 years. The time elapsed between the high Hα emission episode in May 2008 and our maximum in September 2012 would also agree with this time scale.
In addition to large amplitude changes in the strength of the Hα line, IGR J21343+4738 also display marked variations in the shape of the spectral lines. The most prominent spectroscopic evidence of disc activity is the long-term V/R variability, that is, the cyclic variation of the relative intensity of the blue (V) and red (R) peaks in the split profile of the line. The V/R variability is believed to be caused by the gradual change of the amount of the emitting gas approaching the observer and that receding from the observer caused by the precession of a density perturbation in the disc (Kato 1983; Okazaki 1991, 1997; Papaloizou & Savonije 2006). Double-peak symmetric profiles are expected when the high-density part is behind or in front of the star, while asymmetric profiles are seen when the high-density perturbation is on one side of the disc (Telting et al. 1994).
In principle, it is possible from the data alone to find out whether the perturbation travels in the same direction as the Keplerian orbits of the material in the disc (prograde precession) or in opposite direction (retrograde precession). If the motion of the density perturbation is prograde and the disc is viewed at a high inclination angle (as in IGR J21343+4738), then the V > R phase should be followed by a V = R phase with a strong shell profile corresponding to the case where the perturbation lies between the star and the observer (see Telting et al. 1994, for an illustration of prograde motion).
In IGR J21343+4738, as the disc grew, the Hα line changed from a symmetric to an asymmetric profile. When the disc was weak, that is, when the equivalent width of the Hα line was a few ångströms (before 2012), the intensity of the blue and red peaks was roughly equal, V = R. The data reveal that the perturbation developed between the end of 2011 and the beginning of 2012. From August 2012 a blue dominated profile is clearly present (V ≫ R). However, the V/R ratio showed a fast decrease through the 2012 observations (Fig. 2), indicating that the V > R phase was coming to an end. This was confirmed by the January 2013 observations, where an extremely red-dominated profile is seen, V/R ≈ − 0.9.
Comparison of the characteristic time scales of IGR J21343+4738 with other Be/X-ray binaries.
It is worth noticing the extremely fast V/R time scales. Although it is not possible to pin down the exact moment of the onset of the V/R cycle because of an observational gap of about a year (September 2011–August 2012), the changes occurred very rapidly once the cycle started. During the V > R phase, the V/R ratio changed from ~+ 0.4 to ~+ 0.1 in less than one month, September–October 2012 (see Fig. 1 and Table 2). Likewise, the change from a blue-dominated V > R to a red-dominated V < R profile occurred in just two months (October–December 2012). If the motion is prograde, a V = R phase with a strong shell profile should be observed in between the blue-dominated and red-dominated phases. We seem to have missed most of this phase, which would have occurred between October and December 2012. In other words, in just two months the density perturbation must have gone through the shell V = R phase and most of the V < R phase. Extrapolating this behaviour, we estimate the duration of a whole revolution to be 6–9 months. These changes are among the fastest in a BeXB. The very short time scale of the observed V/R variations raises the question of whether these spectral changes are modulated by the orbital period. Phase-locked V/R variations have been observed for various Be binaries with hot companions (Harmanec 2001, and references therein), but possibly only for one BeXB (4U 1258–61). Corbet et al. (1986) found that the probability that the V/R variability observed in 4U 1258–61 was modulated by the X-ray flare period of ~132 d, which was proposed to be the orbital period of the system, was ~87%. Table 4 gives a few well-studied characteristic time scales of BeXBs: the orbital period Porb, the V/R quasi-periods TV/R, and the approximate duration of the formation/dissipation of the disc Tdisc.
In common with other BeXBs (Reig et al. 2005, 2010b), asymmetric profiles are not seen until the disc reaches certain size and density. During the initial stages of disc growth, the shape of the Hα line is always symmetric. Only when EW(Hα) ≳ − 6 Å the Hα line displays an asymmetric profile; IGR J21343+4738 also agrees with this result. As can be seen in Fig. 1, all the spectra during the period 2009–2011 show a symmetric profile and a small EW(Hα). The star took all this time to build the disc. Once a critical size and density was reached (some time at the beginning of 2012), the density perturbation developed and started to travel around in the disc. This result is also apparent from a comparison of the two panels in Fig. 2. Before MJD 55 800, V ≈ R and EW(Hα) is low. After MJD 56 000, a strong asymmetric emission profile is seen.
Although the maximum EW(Hα) measured is relatively small compared to other BeXB, EW(Hα) ≈ − 8 Å, it is consistent with a well-developed disc. In systems viewed edge-on, the maximum EW(Hα) is much smaller than in face-on cases, because the projected area of the optically thick disc on the sky is much smaller (Hummel 1994; Sigut & Patel 2013). On the other hand, although a fully developed disc must have been formed, it may not extend too far away from the star. The fast V/R changes favoured a relatively compact disc, where the density perturbation is able to achieve a complete revolution in a few months.
4.2. Shell lines and disc contribution
The Be star companion in IGR J21343+4738 is a shell star as implied by the deep central absorption between the two peaks of the Hα. This central depression clearly goes beyond the continuum. The shell profiles are thought to appear when the observer’s line of sight toward the central star intersects parts of the disc, which is cooler than the stellar photosphere (Hanuschik 1995; Rivinius et al. 2006). Statistical studies on the distribution of rotational velocities of Be stars are consistent with the idea that Be shell stars are simply normal Be stars seen nearly edge-on, that is, seen at a large inclination angle (Porter 1996). Our observations agree with this idea. Figure 4 clearly shows that the spectral lines are significantly narrower and deeper when the disc is present. The narrower lines would result because the disc conceals the equator of the star, where the contribution to the rotational velocity is largest. The deeper lines would result from absorption of the photospheric emission by the disc. Both circumstances require a high inclination angle. Further evidence for a high inclination angle is provided by the photometric observations. Both positive and negative correlations between the emission-line strength and light variations have been observed and attributed to geometrical effects (Harmanec 1983, 2000). Stars viewed at very high inclination angles show the inverse correlation because the inner parts of the Be envelope partly block the stellar photosphere, while the small projected area of the disc on the sky keeps the disc emission to a minimum. In stars seen at certain inclination angles i < icrit, the effect of the disc is to increase the effective radius of the star; in other words, as the disc grows an overall (star plus disc) increase in brightness is expected. The value of the critical inclination angle is not known, but a rough estimate based on available data suggest icrit ~ 75° (Sigut & Patel 2013). The source IGR J21343+4738 exhibits the inverse correlation, i.e. it becomes fainter at the beginning of a new emission episode (~JD 2 455 800, see Fig. 2).
We have assesed the contribution of the disc on the width of helium lines, which is the main parameter used to estimate the star’s rotational velocity, by measuring the FWHM of the He i 6678 Å over time and by determining the rotational velocity when the disc was present. A difference of up to 7 Å was measured between the witdh of the He i 6678 Å line with and without disc (see Fig. 5). Repeating the calculation performed in Sect. 3.4 on the He i 4026 Å, 4387 Å, and 4471 Å when the disc was present, and using the WHT December 2012 spectra, we obtain vsini = 170 ± 20 km s-1. Thus, the contribution of the disc clearly underestimates the true rotational velocity.
In IGR J21343+4738, the shell profile seems to be a permanent feature. We do not observe any transition from a shell absorption profile to a Be ordinary (i.e. pure emission) profile. In models that favour geometrically thin discs with small opening angles, this result implies that the inclination angle must be well above 70° (Hanuschik 1996). Thus, with such a large inclination angle, the true rotational velocity is estimated to be vrot ~ 380–400 km s-1, and the ratio of the equatorial rotational velocity over the critical break-up velocity3w = vrot/vcrit ~ 0.8.
If gravity darkening is taken into account, then the fractional rotational velocity would be even larger. Gravity darkening results from fast rotation. Rapidly rotating B stars have centrifugally distorted shapes with the equatorial radius larger than the polar radius. As a result, the poles have a higher surface gravity, and thus higher temperature. Gravity darkening breaks the linear relationship between the line width and the projected rotational velocity and makes fast rotators display narrower profiles, hence underestimating the true rotational velocity. The reduction of the measured rotational velocities with respect to the true critical velocity amounts to 10–30%, with the larger values corresponding to the later spectral subtypes (Townsend et al. 2004). Correcting for gravity darkening, the rotational velocity would be vrot ~ ≈ 450 km s-1 (assuming i = 80°) and the fractional rotational velocity of the Be companion of IGR J21343+4738 w ≈ 0.9, confirming the idea that shell stars are Be stars rotating at a near-critical rotation limit. We caution that the values of the break-up velocity assume that it is possible to assign to each Be star a mass and radius equal to that of a much less rapidly rotating B star, for example from well-studied eclipsing binaries. Given that there is not a single direct measurement of the mass and radius for any known Be star, the break-up velocity should be taken as an approximation (see e.g Harmanec 2000).
5. Conclusion
We have performed optical photometric and spectroscopic observations of the optical counterpart to IGR J21343+4738. Our observations show that IGR J21343+4738 is a high-mass X-ray binary with a Be shell type companion. Its long-term optical spectroscopic variability is characterised by global changes in the structure of the equatorial disc. These global changes manifest observationally as asymmetric profiles and significant intensity variability of the Hα line. The changes in the strength of the line are associated with the formation and dissipation of the circumstellar disc. At least since 2009, IGR J21343+4738 has been in an active Be phase that ended in mid 2013, when a disc-loss episode was observed. The duration of the entire formation/dissipation cycle is estimated to be less than five years, although given the lack of data before 2009, this figure needs to be confirmed by future observations. In contrast, the V/R variability is among the fastest observed in BeXBs with characteristic timescales of the order of few weeks for each V/R phase.
The absence of the disc left the underlying B star exposed, allowing us to derive its astrophysical parameters. From the ratios of various metallic lines we have derived a spectral type B1IVe. The width of the He I lines imply a rotational velocity of ~370 km s-1. Using the photometric magnitudes and colours we have estimated the interstellar colour excess E(B − V) ~ 0.76 mag, and the distance d ~ 8.5 kpc.
The presence of shell absorption lines indicate that the line of sight to the star lies nearly perpendicular to its rotation axis. Although the Balmer lines show the most clearly marked shell variability, the helium lines are also strongly affected by disc emission, making them narrower than in the absence of the disc.
Northern hemisphere.
The break-up velocity of a B1Ve star is ~500 km s-1 (Porter 1996; Townsend et al. 2004; Cranmer 2005).
Acknowledgments
We thank the referee P. Harmanec for his useful comments and suggestions, which have improved the clarity of this paper. We also thank observers P. Berlind and M. Calkins for performing the FLWO observations and I. Psaridaki for helping with the Skinakas observations. Skinakas Observatory is a collaborative project of the University of Crete, the Foundation for Research and Technology-Hellas and the Max-Planck-Institut für Extraterrestrische Physik. The WHT and its service programme (service proposal references SW2012b14 and SW2013a19) are operated on the island of La Palma by the Isaac Newton Group in the Spanish Observatorio del Roque de los Muchachos of the Instituto de Astrofísica de Canarias. This paper uses data products produced by the OIR Telescope Data Center, supported by the Smithsonian Astrophysical Observatory. This work has made use of NASA’s Astrophysics Data System Bibliographic Services and of the SIMBAD database, operated at the CDS, Strasbourg, France.
References
- Bessell, M. S. 1990, PASP, 102, 1181 [NASA ADS] [CrossRef] [Google Scholar]
- Bikmaev, I. F., Burenin, R. A., Revnivtsev, M. G., et al. 2008, Astron. Lett., 34, 653 [NASA ADS] [CrossRef] [Google Scholar]
- Bird, A. J., Malizia, A., Bazzano, A., et al. 2007, ApJS, 170, 175 [NASA ADS] [CrossRef] [Google Scholar]
- Clark, J. S., Tarasov, A. E., Steele, I. A., et al. 1998, MNRAS, 294, 165 [NASA ADS] [CrossRef] [Google Scholar]
- Clark, J. S., Tarasov, A. E., Okazaki, A. T., Roche, P., & Lyuty, V. M. 2001, A&A, 380, 615 [NASA ADS] [CrossRef] [EDP Sciences] [Google Scholar]
- Corbet, R. H. D., Smale, A. P., Menzies, J. W., et al. 1986, MNRAS, 221, 961 [NASA ADS] [Google Scholar]
- Cranmer, S. R. 2005, ApJ, 634, 585 [NASA ADS] [CrossRef] [Google Scholar]
- Dachs, J., Kiehling, R., & Engels, D. 1988, A&A, 194, 167 [NASA ADS] [Google Scholar]
- Delgado-Martí, H., Levine, A. M., Pfahl, E., & Rappaport, S. A. 2001, ApJ, 546, 455 [NASA ADS] [CrossRef] [Google Scholar]
- Fabregat, J., & Reglero, V. 1990, MNRAS, 247, 407 [NASA ADS] [Google Scholar]
- Fabricant, D., Cheimets, P., Caldwell, N., & Geary, J. 1998, PASP, 110, 79 [NASA ADS] [CrossRef] [Google Scholar]
- Fitzgerald, M. P. 1970, A&A, 4, 234 [NASA ADS] [Google Scholar]
- Grundstrom, E. D., & Gies, D. R. 2006, ApJ, 651, L53 [NASA ADS] [CrossRef] [Google Scholar]
- Grundstrom, E. D., Boyajian, T. S., Finch, C., et al. 2007, ApJ, 660, 1398 [NASA ADS] [CrossRef] [Google Scholar]
- Gutierrez-Moreno, A. 1979, PASP, 91, 299 [NASA ADS] [CrossRef] [Google Scholar]
- Haigh, N. J., Coe, M. J., & Fabregat, J. 2004, MNRAS, 350, 1457 [NASA ADS] [CrossRef] [Google Scholar]
- Hanuschik, R. W. 1995, A&A, 295, 423 [NASA ADS] [Google Scholar]
- Hanuschik, R. W. 1996, A&A, 308, 170 [NASA ADS] [Google Scholar]
- Harmanec, P. 1983, Hvar Observatory Bulletin, 7, 55 [Google Scholar]
- Harmanec, P. 2000, in IAU Colloq. 175: The Be Phenomenon in Early-Type Stars, eds. M. A. Smith, H. F. Henrichs, & J. Fabregat, ASP Conf. Ser., 214, 13 [Google Scholar]
- Harmanec, P. 2001, Publications of the Astronomical Institute of the Czechoslovak Academy of Sciences, eds. P. Harmanec, P. Hadrava, & I. Hubeny, 89, 9 [Google Scholar]
- Harmanec, P. 2003, in New Directions for Close Binary Studies: The Royal Road to the Stars, eds. O. Demircan, & E. Budding, 221 [Google Scholar]
- Hubeny, I. 1988, Comput. Phys. Commun., 52, 103 [NASA ADS] [CrossRef] [Google Scholar]
- Hubeny, I., & Lanz, T. 1992, A&A, 262, 501 [NASA ADS] [Google Scholar]
- Hubeny, I., Hummer, D. G., & Lanz, T. 1994, A&A, 282, 151 [NASA ADS] [Google Scholar]
- Hummel, W. 1994, A&A, 289, 458 [NASA ADS] [Google Scholar]
- Hummel, W., & Hanuschik, R. W. 1997, A&A, 320, 852 [NASA ADS] [Google Scholar]
- Hummel, W., & Vrancken, M. 2000, A&A, 359, 1075 [NASA ADS] [Google Scholar]
- Humphreys, R. M., & McElroy, D. B. 1984, ApJ, 284, 565 [NASA ADS] [CrossRef] [Google Scholar]
- Jaschek, C., & Jaschek, M. 1987, The classification of stars (Cambridge: University press) [Google Scholar]
- Johnson, H. L. 1966, ARA&A, 4, 193 [NASA ADS] [CrossRef] [Google Scholar]
- Kato, S. 1983, PASJ, 35, 249 [NASA ADS] [Google Scholar]
- Krivonos, R., Revnivtsev, M., Lutovinov, A., et al. 2007, A&A, 475, 775 [NASA ADS] [CrossRef] [EDP Sciences] [Google Scholar]
- Landolt, A. U. 1992, AJ, 104, 340 [NASA ADS] [CrossRef] [Google Scholar]
- Landolt, A. U. 2009, AJ, 137, 4186 [NASA ADS] [CrossRef] [Google Scholar]
- Lanz, T., & Hubeny, I. 2007, ApJS, 169, 83 [CrossRef] [Google Scholar]
- Lyubimkov, L. S., Rostopchin, S. I., Roche, P., & Tarasov, A. E. 1997, MNRAS, 286, 549 [NASA ADS] [CrossRef] [Google Scholar]
- Masetti, N., Parisi, P., Palazzi, E., et al. 2009, A&A, 495, 121 [NASA ADS] [CrossRef] [EDP Sciences] [Google Scholar]
- Negueruela, I. 1998, A&A, 338, 505 [NASA ADS] [Google Scholar]
- Negueruela, I., & Okazaki, A. T. 2001, A&A, 369, 108 [NASA ADS] [CrossRef] [EDP Sciences] [Google Scholar]
- Negueruela, I., Reig, P., Coe, M. J., & Fabregat, J. 1998, A&A, 336, 251 [NASA ADS] [Google Scholar]
- Okazaki, A. T. 1991, PASJ, 43, 75 [NASA ADS] [Google Scholar]
- Okazaki, A. T. 1997, A&A, 318, 548 [NASA ADS] [Google Scholar]
- Okazaki, A. T. 2001, PASJ, 53, 119 [NASA ADS] [CrossRef] [Google Scholar]
- Papaloizou, J. C. B., & Savonije, G. J. 2006, A&A, 456, 1097 [NASA ADS] [CrossRef] [EDP Sciences] [Google Scholar]
- Porter, J. M. 1996, MNRAS, 280, L31 [NASA ADS] [CrossRef] [Google Scholar]
- Quirrenbach, A., Bjorkman, K. S., Bjorkman, J. E., et al. 1997, ApJ, 479, 477 [NASA ADS] [CrossRef] [Google Scholar]
- Reig, P. 2011, Ap&SS, 332, 1 [NASA ADS] [CrossRef] [Google Scholar]
- Reig, P., Negueruela, I., Coe, M. J., et al. 2000, MNRAS, 317, 205 [NASA ADS] [CrossRef] [Google Scholar]
- Reig, P., Negueruela, I., Buckley, D. A. H., et al. 2001, A&A, 367, 266 [NASA ADS] [CrossRef] [EDP Sciences] [Google Scholar]
- Reig, P., Negueruela, I., Fabregat, J., Chato, R., & Coe, M. J. 2005, A&A, 440, 1079 [NASA ADS] [CrossRef] [EDP Sciences] [Google Scholar]
- Reig, P., Larionov, V., Negueruela, I., Arkharov, A. A., & Kudryavtseva, N. A. 2007, A&A, 462, 1081 [NASA ADS] [CrossRef] [EDP Sciences] [Google Scholar]
- Reig, P., Słowikowska, A., Zezas, A., & Blay, P. 2010a, MNRAS, 401, 55 [NASA ADS] [CrossRef] [Google Scholar]
- Reig, P., Zezas, A., & Gkouvelis, L. 2010b, A&A, 522, A107 [NASA ADS] [CrossRef] [EDP Sciences] [Google Scholar]
- Rivinius, T., Štefl, S., & Baade, D. 2006, A&A, 459, 137 [NASA ADS] [CrossRef] [EDP Sciences] [Google Scholar]
- Sazonov, S., Revnivtsev, M., Burenin, R., et al. 2008, A&A, 487, 509 [NASA ADS] [CrossRef] [EDP Sciences] [Google Scholar]
- Sigut, T. A. A., & Patel, P. 2013, ApJ, 765, 41 [NASA ADS] [CrossRef] [Google Scholar]
- Steele, I. A., Negueruela, I., & Clark, J. S. 1999, A&AS, 137, 147 [NASA ADS] [CrossRef] [EDP Sciences] [Google Scholar]
- Stevens, J. B., Reig, P., Coe, M. J., et al. 1997, MNRAS, 288, 988 [NASA ADS] [CrossRef] [Google Scholar]
- Telting, J. H., Heemskerk, M. H. M., Henrichs, H. F., & Savonije, G. J. 1994, A&A, 288, 558 [NASA ADS] [Google Scholar]
- Tokarz, S. P., & Roll, J. 1997, in Astronomical Data Analysis Software and Systems VI, eds. G. Hunt, & H. Payne, ASP Conf. Ser., 125, 140 [Google Scholar]
- Torrejón, J. M., Negueruela, I., & Riquelme, M. S. 2007, in Active OB-Stars: Laboratories for Stellar and Circumstellar Physics, eds. A. T. Okazaki, S. P. Owocki, & S. Stefl, ASP Conf. Ser., 361, 503 [Google Scholar]
- Townsend, R. H. D., Owocki, S. P., & Howarth, I. D. 2004, MNRAS, 350, 189 [Google Scholar]
- Tycner, C., Lester, J. B., Hajian, A. R., et al. 2005, ApJ, 624, 359 [NASA ADS] [CrossRef] [Google Scholar]
- Wegner, W. 1994, MNRAS, 270, 229 [NASA ADS] [CrossRef] [Google Scholar]
- Wegner, W. 2006, MNRAS, 371, 185 [NASA ADS] [CrossRef] [Google Scholar]
All Tables
Log of the spectroscopic observations around the Hα line and results from the spectral analysis.
Comparison of the characteristic time scales of IGR J21343+4738 with other Be/X-ray binaries.
All Figures
|
Fig. 1 Evolution of the Hα and He I 6678 Å lines. Absorption by the disc along the line of sight produces very narrow lines (shell profiles). |
| In the text | |
|
Fig. 2 From top to bottom, evolution of the Hα equivalent width, V/R ratio, V magnitude, (B − V) colour, and velocity shift with time. |
| In the text | |
|
Fig. 3 WHT spectrum of IGR J21343+4738 and identified lines used for spectral classification. The spectrum was smoothed with a Gaussian filter (FWHM = 1). |
| In the text | |
|
Fig. 4 Comparison of two spectra of IGR J21343+4738 at different epochs, when the disc was present (solid black line) and when the disc presumably had vanished (dashed red line). The spectra were taken from the FLWO on 15 October 2012 and 15 July 2013, respectively. |
| In the text | |
|
Fig. 5 Evolution of the FWHM of the He I λ6678 line. Note the progressive narrowing of the line as the shell phase develops and the large values when EW(Hα) is positive (interpreted as the absence of the disc). |
| In the text | |
Current usage metrics show cumulative count of Article Views (full-text article views including HTML views, PDF and ePub downloads, according to the available data) and Abstracts Views on Vision4Press platform.
Data correspond to usage on the plateform after 2015. The current usage metrics is available 48-96 hours after online publication and is updated daily on week days.
Initial download of the metrics may take a while.