| Issue |
A&A
Volume 561, January 2014
|
|
|---|---|---|
| Article Number | A6 | |
| Number of page(s) | 9 | |
| Section | Planets and planetary systems | |
| DOI | https://doi.org/10.1051/0004-6361/201321290 | |
| Published online | 17 December 2013 | |
Observational results for eight long-period comets observed far from the Sun⋆
1 INAF – Osservatorio Astronomico di Capodimonte, via Moiariello 16, 80131 Napoli, Italy
e-mail: This email address is being protected from spambots. You need JavaScript enabled to view it.
2 LESIA, Observatoire de Paris, CNRS, UPMC, Université Paris-Diderot, 5 place Jules Janssen, 92195 Meudon, France
3 Fundación Galileo Galilei – INAF, Rambla José Ana Fernández Pérez 7, 38712 Breña Baja, TF, Spain
4 Universitá Parthenope, Dip. Scienze Applicate, Centro Direzionale Isola C4, 80143 Napoli, Italy
5 Max Planck Institute for Solar System Research, Max-Planck-Str. 2, 37191 Katlenburg-Lindau, Germany
6 Instituto de Astrofísica de Canarias, c/vía Láctea s/n, 38200 La Laguna, Tenerife, Spain
7 Departamento de Astrofísica, Universidad de La Laguna, 38205 La Laguna, Tenerife, Spain
8 INAF – Osservatorio Astrofisico di Arcetri, Largo Enrico Fermi 5, 50125 Firenze, Italy
Received: 14 February 2013
Accepted: 31 October 2013
Abstract
Context. With this work we start a systematic analysis of the distant activity of several long-period comets in order to investigate the evolution of activity throughout the solar system and explore differences between comets that pass their perihelion at far or very close distances from the Sun.
Aims. We present observational data for eight long-period comets, observed for the first time beyond r = 5 AU. Three targets have been characterised on their inward orbital branch. The others have passed their perihelion at quite large heliocentric distances (rq from 4.5 to 7.5 AU).
Methods. We analyse multicolour broadband images (V,R, and I filters) taken at the Telescopio Nazionale Galileo to characterise the dust coma of the comets and investigate their morphology, photometry, colours, and dust production.
Results. The morphological analysis shows many differences among the sample, from the large twisted structure present in the coma of comet C/2005 L3 to the regular coma envelope of C/2010 R1. The colour of the dust coma of all the comets is redder than the Sun. The Afρ value (measured in a reference aperture of radius ρ = 104 km) ranges from 114 ± 2 (C/2005 S4) to 5091 ± 47 (C/2005 L3) cm, depicting a scenario of bodies from moderately to very active. This is confirmed by the first-order quantitative estimate of the dust mass-loss rate for the comets that was obtained from the photometric data: assuming a grain velocity of v = 20 m/s, the dust production rate is comparable with, or even significantly larger than, that measured for many short-period (“old”) comets at much smaller heliocentric distances.
Key words: comets: general
Based on observations collected at the Italian Telescopio Nazionale Galileo (TNG), operated on the island of La Palma by the Centro Galileo Galilei of the INAF (Istituto Nazionale di Astrofisica) at the Spanish Observatorio del Roque de los Muchachos of the Instituto de Astrofísica de Canarias.
© ESO, 2013
1. Introduction
The long-period comets (LPCs) probably formed in the same region as the giant planets (the Jupiter-Neptune zone), in a warmer thermal environment than did the short-period comets (SPCs), the Kuiper belt objects (KBOs), and the Centaurs, and then scattered towards the Oort cloud region (Meech & Svoren 2004). Moreover, recent models of the solar system (Levison et al. 2010) suggest that many other comets in the Oort Cloud may have an extrasolar origin (captures from protoplanetary discs of other stars). All the above models have strong consequences on the abundances and composition of trapped gas and on cometary activity (Meech et al. 2009).
Orbital parameters of the target comets.
Observing circumstances.
There is much reference in the literature to “new” comets (i.e. comets that never or rarely passed through the inner solar system) being intrinsically more active at large distances from the Sun than the periodic (“old”) comets (i.e. comets for which many passages inside the solar system have been recorded) (Meech 1988, 1990, 1992). As of July 2013, very few (<20) LPCs have been observed and studied at distances from the Sun larger than 5–6 AU, where it is too cold for the “canonical” sublimation of crystalline water ice to explain cometary activity (Meech & Svoren 2004).
Postperihelion activity beyond 5–6 AU could be caused by a perihelion heat wave that penetrates into volatile-rich depths in the nucleus, causing the amorphous-to-crystalline water ice transition (Notesco et al. 2003; Bar-Nun & Laufer 2003) and the following release of hypervolatile gas. Comets that have never been close enough to the Sun to experience significant heating require a different mechanism. Up to now, only seven such comets have been observed preperihelion (Korsun & Chorny 2003; Tozzi et al. 2003; Meech et al. 2009; Korsun et al. 2010), and five of them had then a large (r > 5 AU) q passage.
In the recent past, the distant dust environment of the comets C/2003 O1 (LINEAR) at 7.4 AU post-q (Mazzotta Epifani et al. 2009) and C/2007 D1 (LINEAR) at 9.7 AU post-q (Mazzotta Epifani et al. 2010) has been quantitatively studied, deriving unexpectedly high dust production rates (~30 kg s-1 and >500 kg s-1, respectively), of the same order of magnitude or even larger than that of old periodic comets at much smaller heliocentric distances (see, e.g., Mazzotta Epifani & Palumbo 2011). Unfortunately, very few similar studies for LPCs on their pre-q orbital branch are presently available. Moreover the current rate of discovery of large-q LPCs is quite low, at about 0.83 yr-1 (Francis 2005), but new surveys such as Pan-STARRS (Kaiser et al. 2002) and the Large Synoptic Survey Telescope (LSST, Wolffs et al. 2007) will increase this rate.
In 2009 we started an observational programme for a systematic investigation of the distant dust environment of several LPCs at very large heliocentric distances, beyond the “water” zone. The comet C/2007 D1 (LINEAR) (Mazzotta Epifani et al. 2010) was observed among the sample, and its exceptional activity at almost 10 AU post-q was promptly reported.
The aim of this paper is to study the coma properties of the other eight comets in our first sample, which covers both the returning and dynamically new groups of LPCs, with some on their inbound and some on their outbound orbital branch. The study presented here increases the sample of these targets characterised by multicolour photometry when far from the Sun by 50%. It adds three targets, never characterised before, to the still sparsely populated subgroup of pre-q dynamically new LPCs presently characterised.
Section 2 describes observations and data reduction. In Sect. 3 we describe the observational results from each of the comets’ coma characteristics (morphology and colours). Section 4 is dedicated to the discussion of the dust mass-loss rates derived from cometary photometry. Summary and conclusions are given in Sect. 5.
2. Observations and data reduction
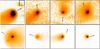 |
Fig. 1 From left to right and from top to bottom, median-averaged image obtained for comets C/2005 L3, C/2005S4, C/2007JA21, C/2007 M1, C/2008 FK75, C/2009 S3, C/2010 R1, and C/2011 L4 in the R filter. Each image has a width of 105 km at the comet’s distance, except that for comet C/2005 L3, which covers 5 × 10⁵ km. In this image, the black box in the upper-right corner has the same size as the other images. For all the images, N is up and E is on the left. The black arrow indicates the direction towards the Sun. |
The observations of eight LPCs were performed on two observing runs at the 3.52 m Telescopio Nazionale Galileo (TNG) at the Observatorio del Roque de los Muchachos (La Palma, Canary Islands) in May 2009 and June 2011. The target comets and their orbital parameters are listed in Table 1: three returning and five dynamically new LPCs were observed. The observing circumstances are presented in Table 2.
The images were obtained with the Device Optimised for the LOw RESolution (DOLORES) instrument1, equipped with the broadband filters V, R, and I of the Johnson-Cousin system.
During two nights in May 2009 and one night in June 2011, several long (300 or 600 s) exposures were obtained for the targets, with the telescope tracking at the nonsidereal rate corresponding to the predicted motion of the comet. Not all filters were used for all the targets, due to lack of time and faintness of the targets, see Table 2. All the images were corrected for overscan, bias, and flat-fielding in the standard manner, using tools available in IRAF2 and in ESO’s Munich Image Data Analysis System (MIDAS). To perform an absolute flux calibration of the comet images, we observed appropriate fields from the list of Landolt (1992) at different airmasses each observing night. The nights in May 2009 were both photometric; the night in June 2011 was only partly photometric.
Despite the large heliocentric distance of observation, each target was easily identifiable and appeared well active in each of the single exposures. In order to increase the signal-to-noise ratio (S/N) and to remove any residual background star contribution, we median averaged the images for each target and for each filter after recentering them to the comet optocentre. We found the omet optocentre by fitting a two-dimensional Gaussian curve to the innermost pixels of the coma. Then, the sky correction was performed by subtracting a first-order polynomial sky approximation computed from the pixel areas of the same median-averaged comet image, both containing no stars and far away from a possible coma contamination.
Figure 1 shows for each comet a subimage of the obtained median-averaged image in the R filter as described above. All the images are centred on the comet optocentre. Also, V and I images were obtained for some of the comets.
3. Observational results
3.1. Coma morphology
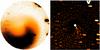 |
Fig. 2 Radial-normalised (left) and Laplace-filtered (right) image obtained in the R filter for comet C/2005 L3. Each image is 75.9′′ × 75.9′′ (linear scale: 3.4 × 10⁵ km). |
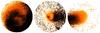 |
Fig. 3 From left to right, radial-normalised images obtained in the R filter for comets C/2008 FK75, C/2009 S3, and C/2010 R1. Each image is 25.5′′ × 25.5′′ (linear scale: 9.2 × 10⁴ km, 1.2 × 10⁵ km, and 9.6 × 10⁴ km for the three comets, respectively). |
Coma morphology is a powerful tool to investigate the nucleus and coma properties by observing and interpreting different features such as bright jets, fans, and arc structures (see the recent review by Farnham 2009). The R band-pass filter used (λ = 644 nm, FWHM 148 nm) is the least affected by possible gaseous emission lines. We used images taken with this filter to search for distinct dust extended features. For this purpose we applied one or two analysis techniques to the coma images, depending on image quality and S/N.
The first technique is the radial normalisation method (Birkle & Boehnhardt 1992), which reduces the general coma background and enhances faint coma structures. It has been applied to cometary broadband images in many previous works (e.g. Lara et al. 2009; Mazzotta Epifani & Palumbo 2011), to which we refer for more details.
The second technique is the adaptive Laplace filtering method (Boehnhardt & Birkle 1994), which is sensitive to gradient changes on different spatial scales, depending on the width of the spatial filter applied. We applied this method to better investigate anisotropy found by means of the radial normalisation in the dust coma of comet C/2005 L3 (see below).
Figures 2 and 3 show the processed R-filter images obtained for some of the target comets (those for which we obtained images with high enough S/N).
Comet C/2005 L3: the comet clearly shows deviation from the classical aspect of a diffuse nebulosity surrounding the nucleus. The radial-normalised image enhances the presence of a large twisted structure extending mostly in the south. A well-defined jet-like structure is evident in the Laplace-filtered image, extending in the same direction as the spiral’s axis of symmetry. While the overall coma structure could be due to a fan being bent by radiation pressure into the tail direction, it could also be a hint of nucleus rotational effects in the presence of an active area on the comet’s nucleus.
Comet C/2008 FK75: the comet shows some faint twisting structures that are similar to arcs and/or spirals and barely perceptible under the overall shape of the ambient coma. The presence of these multiple and successively larger nested shells could suggest a scenario of cyclic dust outflow from the nucleus, which may be linked to some specific physical nucleus properties and/or geometrical conditions. Unfortunately, snapshot observations like the one presented in this paper do not allow periodicity to be enhanced and the activity throughout a rotational cycle to be charecterised. The structures are quite faint and are not clearly evident in the Laplace-filtered image.
Comet C/2009 S3: the comet is characterised by a fan-shaped tail extended along the W direction. In addition, an excess in the anti-tail direction is well visible above the surrounding “regular” coma in the radial-normalised image. We checked whether this excess could be due to an artifact of the image processing, but it is present in the same position relative to the comet in all the single images used for the final median average. As the comet optocentre moves about 68 arcsec in the field between the first and the last image of the sequence, we can exclude the possibility that the excess is due to a residual field star and interpret it as an asymmetric dust outflow that is strongly limited in space.
Comet C/2010 R1: this comet acts as an example of a regular coma envelope, with no evidence of subtle radial or azimuthal structure present in the dust coma.
For comets C/2005 S4, C/2007 JA21, C/2007 M1, and C/2011 L4, the obtained S/N was not high enough to get reliable results from the image processing. The general aspect of these comets is quite standard and similar in all the filters in which we obtained images (see Fig. 1): a small condensation close to the nucleus and a more or less extended broad tail-like structure. For comet C/2011 L4, the tail-like elongation was still very small at the time of observation.
3.2. Coma photometry
The integrated magnitudes of the coma, which are derived for all the filters in the reference optical aperture of ρ = 104 km centred on the optocentre, are listed in Table 3. The final uncertainty in the magnitude comes from the calibration error σcalib (rms of the standard stars fit, weighted by the star counts against the background).
Table 3 also summarises the coma colours obtained in the reference optical aperture. From the comparison of cometary values with the solar ones, we observe that most target comets appear from slightly to significantly redder than the Sun, even if for some of them the error on the colour is too large to secure a significant reddening trend. However, this comparison should be carefully regarded since the colour index strictly depends on observational and data reduction constraints (e.g. aperture size used to compute the magnitude). Moreover, coma colours are integrated properties and, as such, depend significantly on short-term scale variations in the spatial distribution of the dust.
Observational results for the target comets.
The colour changes with radial distance from coma center are interesting to explore in order to investigate the whole dust environment of the coma, e.g. if optical properties of dust grains vary within the coma due to processes such as sublimation or fragmentation. For most of the comets (V − R for five comets, R − I for three), our data allow a first-order investigation of the colour trend with cometocentric radial distance. Actually, the error on the colour indices is sometimes (i.e. for some comets in the sample) too large to secure a significant trend with the cometocentric distance. Moreover, the apparent projected size of the coma is generally different from comet to comet, thus preventing a comparative analysis of the indices behaviour among the sample. Nevertheless, when considering the actual values of colour indices, we noticed that for comets C/2007 JA21, C/2005 S4, C/2009 S3, and C/2010 R1 the trend ranges from being constant (C/2009 S3, C/2010 R1) to an increasing reddish colour with the radial distance (C/2007 JA21, C/2005 S4). The only remarkable exception is comet C/2008 FK75, for which (V − R) and mostly (R − I) colours decrease with the radial distance, indicating that there are significant variations towards bluer dust colour with increasing radial distance. This could indicate sublimation of ices present on dust grains, as already observed in, for example, comet 103P/Hartley 2 (Lara et al. 2011).
3.3. Afρ
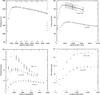 |
Fig. 4 R-band Afρ trend versus cometocentric distance measured for target comets. Top left: comet C/2005 L3; top right: comets C/2007 M1 and C/2008 FK75; bottom left: comets C/2009 S3, C/2010 R1 and C/2001 L4; bottom right: comets C/2005 S4 and C/2007 JA21. |
The Afρ value expressed in cm (A’Hearn et al. 1984), where A is the average grain geometric albedo, f the filling factor in the aperture field of view, and ρ the linear radius of the aperture at the comet, i.e. the sky-plane radius, is usually used as a proxy for the cometary dust production. When the cometary coma is in a steady state, Afρ is an aperture-independent parameter.
Figure 4 shows the trend of R-band Afρ for the target comets with the cometocentric distance (computed up to a distance for which the coma is measured to be 3σ above the background: this also allows an indication of the projected extension of the dust coma of each target to be obtained). After a more or less steep increase in the inner part of the coma, which is affected by the seeing and observable in all targets, for most of the comets (C/2005 L3, C/2007 M1, C/2008 FK75 C/2009 S3, C/2010 R1, and C/2011 L4) it is possible to clearly identify a decrease in Afρ with the nucleocentric distance ρ. A similar decrease has been often attributed to non steady state dust emission and possibly dust grain fading or destruction (Lara et al. 2004; Tozzi et al. 2003) and/or to fresh dust production within the coma, even if the latter process is more likely to be observed during close passages to the Sun (Tozzi et al. 2011). This decrease is not observed for the remaining two comets (C/2005 S4 and C/2007 JA21), but it could be that the relatively small apparent coma extension and low activity level prevented such a detection with our data. The decrease in Afρ is clearly observable, with a similar relatively small apparent coma extension in comets C/2010 R1 and C/2011 L4.
The Afρ values for the target comets, which are derived for the R filter in the reference optical aperture of ρ = 104 km, are listed in Table 4, together with the maximum R-band Afρ and the relative aperture radius. The Afρ trend is quite different among the sample. For comets C/2010 R1 and C/2011 L4, for example, the maximum is reached at low ρ and followed by a quite steep decrease, while for comets C/2005 S4 and C/2007 JA21 (of similar apparent coma extension) the maximum is reached later. Then the trend is quite constant with the cometocentric distance.
Af ρ values for the target comets, derived for all the filters in the reference optical aperture of ρ = 104 km and centred on the optocentre.
It is hard to choose one Afρ value for each comet to compare results among our sample and with values in literature. In fact, Afρ is often used to compare the dust production rate between comets, but one should keep in mind that it involves several observational and physical parameters: the aperture size if the Afρ is not constant with the cometocentric distance; the geometric albedo of the grains, which depends in turn on the observing phase angle and wavelength; the grain size distribution. Nevertheless, as a general rule it is assumed that large Afρ values indicate high dust activity. The results obtained for the eight targets in our sample confirm indeed that these comets are moderately to very active objects. Figure 5 shows the comparison of R-band Afρ obtained in the reference aperture of ρ = 104 km in the present paper with the values obtained for several cometary objects (SPCs and LPCs) in the past, from both snapshot and monitoring observations.
Comet C/2005 L3 appears to be the most active comet in our sample, but all the comets show R-band Afρ values at least of the same order of, but in many cases much greater than, those measured for other active objects (also including different dynamical groups) at much smaller heliocentric distances, where Afρ is supposed to be larger. In particular, Fig. 5 (right-hand panel) shows that the median value of LPCs’ Afρ, both close to (<2–3 AU) and far from (>3 AU) the Sun, is larger than values measured for SPCs (the direct comparison is obviously impossible above 5 AU).
4. Dust mass production rate
The Afρ parameter is considered a good proxy for the dust activity, but it does not directly provide the dust production rate Qd. To obtain a first-order quantitative estimate of the dust mass-loss rate for our target comets, we applied a “photometric model”, which relates the optical photometry to the dust production rate via some realistic assumptions on the cometary dust environment. The method is derived from the one used by Jewitt (2009) to compute the dust production rate of active Centaurs in the region between 5 and 12 AU; it was adapted and already successfully applied by our group to cometary environment. We refer to Mazzotta Epifani et al. (2010) and Mazzotta Epifani & Palumbo (2011) for further details on the method. Here we recall that the method consists of estimating the total cross section Cd of the coma dust particles in a conveniently chosen annulus by means of coma photometry, following the expression by Russell (1916): pRΦ(α)Cd = 2.25 × 10²²πr2Δ210− 0.4(md − mS) (r and Δ: heliocentric and geocentric distances, α: phase angle, mS: magnitude of the Sun in the R filter; md: apparent R magnitude in the annulus; pR: geometric albedo). The annulus is selected in the coma such that any possible nucleus contribution is excluded and the effects of residual sky background are minimised. The dust cross section Cd derived from the photometry is then related to the dust mass Md through the adoption of a power-law dust size distribution. Finally, the dust mass-loss rate Qd is obtained by considering the time of residence of dust grains in the projected coma annulus, which is dependent on the radial outflow speed of the dust grains at the heliocentric distance r of observation.
Several realistic assumptions are needed to derive quantitative values of Qd:
Geometric albedo pR: we adopted the typical value for comet nuclei of pR = 0.04; this is an important factor in the uncertainty in our calculations since the actual albedo of dust grains is unknown.
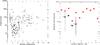 |
Fig. 5 Left: R-band Afρ values measured for target comets (open squares) compared to values derived for several minor bodies: SPCs (dots), active Centaurs (stars), and LPCs (triangles). Literature was searched for both snapshot and monitoring observations: Mazzotta Epifani & Palumbo (2011, and references therein), Mazzotta Epifani et al. (2008, and references therein), Solontoi et al. (2012), Szabó et al. (2002), Ivanova et al. (2011), Jewitt (2009), Mazzotta Epifani et al. (2011, 2006), Bauer et al. (2003), Lara et al. (2003), Mazzotta Epifani et al. (2010), Korsun et al. (2010), Mazzotta Epifani et al. (2009, and references therein), Meech et al. (2009). (Right) Median R-band Afρ values in heliocentric distance ranges of 1 AU for SPCs (black diamonds) and LPCs (red diamonds). The number of values available to compute the median is indicated close to each symbol. The black vertical dashed lines indicate the “cloud” (min-max values) for each point in the SPCs’ sample. |
Phase darkening Φ(α): the shape of this function depends upon a variety of properties of dust particles, including the distribution in size, roughness, and albedo. We adopted “Schleicher’s method” (Schleicher et al. 1998; Schleicher 2007), which reckons on the shallower dust comae phase function with respect to that of the bare cometary nucleus. Since all the comets in our sample were observed at small (<12°) phase angles, we used the tabulated values of Schleicher’s curve normalised at 0° (asteroid.lowell.edu/comet/dustphaseHM_table.txt).
Power-law dust size distribution: numerical modelling of dust tails for some LPCs (Fulle et al. 1998; Korsun & Chorny 2003; Mazzotta Epifani et al. 2009; Korsun et al. 2010) suggests the adoption of the plausible value of q = −3.5 for grains between a− = 10 μm and a+ = 1 cm for compact cometary grains of bulk density ρ = 1000 kg/m3. This is similar to the dust environment assumed for several SPC tails (see a summary in Fulle 1999) and for active Centaurs (Jewitt 2009).
Dust outflow velocity v(r): in the past, the application of an inverse numerical model to coma images allowed reconstruction of the dynamical evolution of the dust environment for a number of comets, including the dust grain velocity (strictly dependent on dust size), at large heliocentric distance (e.g. Mazzotta Epifani et al. 2009; Korsun & Chorny 2003). In this work, we considered a dust grain velocity between 1 and an estimated realistic upper limit of 50 m/s.
Table 5 summarises, for each comet, the values derived for all the model quantities and the dust production rate Qd for the reference velocity value of v = 20 m/s.
Figure 6 shows the dust mass-loss rate for the target comets, compared with values found in literature for other minor bodies: SPCs, active Centaurs, and other LPCs. A direct comparison between Qd is not so straightforward since several model and observational factors highly influence the resulting dust mass-loss rate. For example, our results, given in terms of a lower-to-upper limit, are based on a realistic assumption of the grain velocity, which remains unknown at present (together with its dependence on grain size). Furthermore, there is a surprising lack of dust production rate measurements for LPCs at short heliocentric distances.
Model dust mass-loss rate for target comets.
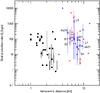 |
Fig. 6 Dust mass-loss rate of target comets (blue open squares: values computed for the reference velocity of v = 20 m/s; blue vertical lines: min-max range computed by means of the photometric model for grain velocity from 1 to 50 m/s) compared to values for several minor bodies: SPCs (black dots: single observations; black vertical lines: min-max range derived for typical/depleted comet classification or range computed by means of the photometric model for different grain velocity values; see Mazzotta Epifani & Palumbo (2011; their Fig. 12) and references therein), active Centaurs (red stars: single observations; red vertical lines: min-max range computed by means of the photometric model for different grain velocity values; see Mazzotta Epifani et al. 2006, 2011; Bauer et al. 2003; Ivanova et al. 2011), and LPCs (blue triangles: single observations; blue vertical lines: min-max range computed by means of the photometric model for different grain velocity values; see Fulle et al. 1998; Mazzotta Epifani et al. 2009; Ivanova et al. 2011). |
Nevertheless, from the general trend pictured in Figs. 5 and 6 it is possible to conclude that it is not an observational bias that LPCs are more active than SPCs. It is true that the more distant LPCs would not have been discovered if they were of low activity (whereas nearby short comets can be), and it is also true that very distant cometary activity (i.e. >5 AU) can never be compared for the two groups. But when comparing activity close to the Sun, which is mainly driven by water, the average activity of LPCs is greater than that of SPCs. One potential explanation is the fact that SPCs are much older (having spent much more time close to the Sun than LPCs) and therefore have dust mantles and/or are depleted in volatiles.
5. Summary and conclusions
We present multicolour broad band photometry of a sample of eight long-period comets, observed for the first time at heliocentric distance r > 5 AU with the 3.52 m TNG telescope. Three of them are long-period, returning comets, and five are dynamically new comets. Some of the target comets were observed on their inbound orbital branch, while the others were observed after their perihelion passage at heliocentric distance rq > 5.6 AU, i.e. well outside the so-called “water zone”.
Our main results can be summarised as follows:
-
1.
Morphological analysis was performed for some of the targetcomets: they vary considerably in appearance. Comet C/2005 L3(McNaught) shows a large twisted structure. CometC/2008 FK75 (Lemmon-Siding Spring) showssome faint twisting structures, similar to arcs and/or spirals andbarely perceptible under the overall shape of the ambient coma.Comet C/2009 S3 (Lemmon) is characterised by afan-shaped tail, with an excess in the anti-tail direction that isinterpreted as an asymmetric dust outflow that is strongly limitedin space.
-
2.
The analysis of multiband photometry data showed that most target comets are slightly to significantly redder than the Sun, even if for some of them the error on the colour is too large to secure a significant reddening trend, e.g. with the radial cometocentric distance. Comet C/2008 FK75 shows indications of colour indices (mostly (R − I)) decreasing with the radial distance, indicating that there are significant variations towards bluer dust colour with increasing radial distance. This could point to sublimation of ices present on dust grains.
-
3.
The R-band Afρ values in the reference aperture of ρ = 104 km range from 114 ± 2 cm for comet C/2005 S4 (McNaught) to the extraordinarily high value of 5091 ± 47 cm for comet C/2005 L3 (McNaught).
-
4.
By means of a “photometric model”, which relates the optical photometry to the dust production rate, we obtained a first-order quantitative estimate of the dust mass-loss rate for the target comets. Assuming an average grain radius in the coma of ⟨ a ⟩ = 30 μm and a reference grain outflow velocity of v = 20 m/s, a dust mass-loss rate
 from 31 (C/2005 S4 (McNaught)) to 1.4 × 10³ (C/2005 L3 (McNaught)) kg/s was derived among the sample.
All the results obtained during the observational campaign and summarised above confirm the scenario of “new” comets being intrinsically more active than periodic “old” comets. After their passage at a quite distant perihelion, five comets were observed on their outward orbital branch. Their post-q activity is variable among the sample: e.g. C/2005 L3 (McNaught) and C/2005 S4 (McNaught) both passed at q ≈ 6 AU in their present passage, and their dust mass-loss rate values, measured at similar heliocentric distances, bracket the values obtained for all the targets. This confirms the extreme variability that can be found inside a sample of targets traditionally seen as a “group”, and probably reflects the different size, size evolution (e.g. fragmentation), volatile compositions, and, in turn, the different formation regions of these bodies. Moreover, these comets (especially the dynamically new ones) have never or very rarely been close to the Sun enough to experience a significant heating that would explain, at least partially, the post-q release of hypervolatile gas at large heliocentric distances. These results pose important constraints on the studies on the mechanism(s) required to model their activity.
Another interesting issue explored by this paper, which opens many future observational perspectives, is the analysis of very distant, pre-q cometary activity for three long-period comets never characterised before. Two of them are dynamically new in our solar system: C/2010 R1 (LINEAR) passed its perihelion at 5.6 AU in May 2012 and C/2011 L4 (PANSTARRS) did so at 0.3 AU in March 2013. They will offer in the near future the possibility to follow up and study the evolution along their orbit of two Oort cloud comets and to explore the differences of two (maybe) similar bodies, each with a very different destiny inside our solar system.
IRAF is distributed by the National Optical Astronomical Observatory, which is operated by the Association of Universities for Research in Astronomy, Inc., under cooperative agreement with the National Science Foundation.
Acknowledgments
We gratefully acknowledge funding from Italian Space Agency (ASI) under contract I/062/08/00. J.L. gratefully acknowledges support from the Spanish “Ministerio de Ciencia e Innovación” project AYA2011-29489-C03-02. C.S. received funding from the European Union Seventh Framework Program (FP7/2007-2013) under grant agreement No. 268421.
References
- A’Hearn, M. F., Schleicher, D. G., Feldman, P. D., Millis, R. L., & Thompson, D. T. 1984, AJ, 89, 579 [NASA ADS] [CrossRef] [Google Scholar]
- Bar-Nun, A., & Laufer, D. 2003, Icarus, 161, 157 [NASA ADS] [CrossRef] [Google Scholar]
- Bauer, J. M., Fernandez, Y. R., & Meech, K. J. 2003, PASP, 115, 981 [NASA ADS] [CrossRef] [Google Scholar]
- Birkle, K., & Boehnhardt, H. 1992, Earth, Moon, and Planets, 57, 191 [Google Scholar]
- Boehnhardt, H., & Birkle, K. 1994, A&AS, 107, 101 [NASA ADS] [Google Scholar]
- Farnham, T. L. 2009, PSS, 57, 1192 [Google Scholar]
- Francis, P. J. 2005, AJ, 635, 1348 [NASA ADS] [CrossRef] [Google Scholar]
- Fulle, M. 1999, Planet. Space Sci., 47, 827 [NASA ADS] [CrossRef] [Google Scholar]
- Fulle, M., Cremonese, G., & Bóhm, C. 1998, AJ, 116, 1470 [NASA ADS] [CrossRef] [Google Scholar]
- Holmberg, J., Flynn, C., & Portinari, L. 2006, MNRAS, 367, 449 [NASA ADS] [CrossRef] [Google Scholar]
- Ivanova, O. V., Skorov, Y. V., Korsun, P. P., Afanasiev, V. L., & Blum, J. 2011, Icarus, 211, 559 [NASA ADS] [CrossRef] [Google Scholar]
- Jewitt, D. C. 2009, AJ, 137, 4296 [NASA ADS] [CrossRef] [Google Scholar]
- Kaiser, N., Aussel, H., Burke, B. E., et al. 2002, Proc. SPIE, 4836, 154 [NASA ADS] [CrossRef] [Google Scholar]
- Korsun, P. P., & Chorny, G. F. 2003, A&A, 410, 1029 [NASA ADS] [CrossRef] [EDP Sciences] [Google Scholar]
- Korsun, P. P., Kulyk, I. V., Ivanova, O. V., et al. 2010, Icarus, 210, 916 [NASA ADS] [CrossRef] [Google Scholar]
- Landolt, A. U. 1992, AJ, 104, 1, 340 [NASA ADS] [CrossRef] [Google Scholar]
- Lara, L. M., Licandro, J., & Tozzi, G. P. 2003, A&A, 404, 373 [NASA ADS] [CrossRef] [EDP Sciences] [Google Scholar]
- Lara, L. M., Tozzi, G. P., Boehnhardt, H., DiMartino, M., & Schulz, R. 2004, A&A, 422, 717 [NASA ADS] [CrossRef] [EDP Sciences] [Google Scholar]
- Lara, L. M., Licandro, J., & Tozzi, G. P. 2009, A&A, 497, 843 [Google Scholar]
- Lara, L. M., Lin, Z.-Y., & Meech, K. 2011, A&A, 532, A87 [NASA ADS] [CrossRef] [EDP Sciences] [Google Scholar]
- Levison, H. F., Duncan, M. J., Brasser, R., & Kaufmann, D. E. 2010, Science, 329, 187 [NASA ADS] [CrossRef] [Google Scholar]
- Mazzotta Epifani, E., & Palumbo, P. 2011, A&A, 525, A62 [NASA ADS] [CrossRef] [EDP Sciences] [Google Scholar]
- Mazzotta Epifani, E., Palumbo, P., Capria, M. T., et al. 2006, A&A, 460, 935 [NASA ADS] [CrossRef] [EDP Sciences] [Google Scholar]
- Mazzotta Epifani, E., Palumbo, P., Capria, M. T., et al. 2008, MNRAS, 390, 265 [NASA ADS] [CrossRef] [Google Scholar]
- Mazzotta Epifani, E., Palumbo, P., Capria, M. T., et al. 2009, A&A 502, 355 [Google Scholar]
- Mazzotta Epifani, E., Dall’Ora, M., Di Fabrizio, L., et al. 2010, A&A, 513, A33 [NASA ADS] [CrossRef] [EDP Sciences] [Google Scholar]
- Mazzotta Epifani, E., Dall’Ora, M., Perna, D., Palumbo, P., & Colangeli, L. 2011, MNRAS, 415, 3097 [NASA ADS] [CrossRef] [Google Scholar]
- Meech, K. J. 1988, BAAS, 20, 835 [NASA ADS] [Google Scholar]
- Meech, K. J. 1990, BAAS, 22, 1103 [NASA ADS] [Google Scholar]
- Meech, K. J. 1992, BAAS, 24, 993 [NASA ADS] [Google Scholar]
- Meech, K. J., & Svoren, J. 2004, in Comets II, eds. M. Festou, H. U. Keller, & H. A. Weaver (Tucson: Univ. Arizona Press) [Google Scholar]
- Meech, K. J., Pittichova, J., Bar-Nun, A., et al. 2009, Icarus, 201, 719 [NASA ADS] [CrossRef] [Google Scholar]
- Notesco, G. A., Bar-Nun, A., & Owen, T. 2003, Icarus, 162, 183 [NASA ADS] [CrossRef] [Google Scholar]
- Russell, H. N. 1916, ApJ, 43, 173 [NASA ADS] [CrossRef] [Google Scholar]
- Schleicher, G. 2007, Icarus, 190, 406 [NASA ADS] [CrossRef] [Google Scholar]
- Schleicher, D. G., Millis, R. L., & Birch, P. V. 1998, Icarus, 132, 397 [NASA ADS] [CrossRef] [Google Scholar]
- Solontoi, M., Ivezic, Z., Juric, M., et al. 2012, Icarus, 218, 571 [NASA ADS] [CrossRef] [Google Scholar]
- Szabó, G. M., Kiss, L. L., Sárneczky, K., & Sziládi, K. 2002, A&A, 384, 702 [NASA ADS] [CrossRef] [EDP Sciences] [Google Scholar]
- Tozzi, G. P., Boehnhardt, H., & LoCurto, G. 2003, A&A, 398, L41 [NASA ADS] [CrossRef] [EDP Sciences] [Google Scholar]
- Tozzi, G. P., Patriarchi, P., Boehnhardt, H., et al. 2011, A&A, 531, A54 [NASA ADS] [CrossRef] [EDP Sciences] [Google Scholar]
- Wolffs, S., Sweeney, D., Tyson, J. A. et al. 2007, AAS meeting #211, BAAS, 39, 978 [Google Scholar]
All Tables
Af ρ values for the target comets, derived for all the filters in the reference optical aperture of ρ = 104 km and centred on the optocentre.
All Figures
|
Fig. 1 From left to right and from top to bottom, median-averaged image obtained for comets C/2005 L3, C/2005S4, C/2007JA21, C/2007 M1, C/2008 FK75, C/2009 S3, C/2010 R1, and C/2011 L4 in the R filter. Each image has a width of 105 km at the comet’s distance, except that for comet C/2005 L3, which covers 5 × 10⁵ km. In this image, the black box in the upper-right corner has the same size as the other images. For all the images, N is up and E is on the left. The black arrow indicates the direction towards the Sun. |
| In the text | |
|
Fig. 2 Radial-normalised (left) and Laplace-filtered (right) image obtained in the R filter for comet C/2005 L3. Each image is 75.9′′ × 75.9′′ (linear scale: 3.4 × 10⁵ km). |
| In the text | |
|
Fig. 3 From left to right, radial-normalised images obtained in the R filter for comets C/2008 FK75, C/2009 S3, and C/2010 R1. Each image is 25.5′′ × 25.5′′ (linear scale: 9.2 × 10⁴ km, 1.2 × 10⁵ km, and 9.6 × 10⁴ km for the three comets, respectively). |
| In the text | |
|
Fig. 4 R-band Afρ trend versus cometocentric distance measured for target comets. Top left: comet C/2005 L3; top right: comets C/2007 M1 and C/2008 FK75; bottom left: comets C/2009 S3, C/2010 R1 and C/2001 L4; bottom right: comets C/2005 S4 and C/2007 JA21. |
| In the text | |
|
Fig. 5 Left: R-band Afρ values measured for target comets (open squares) compared to values derived for several minor bodies: SPCs (dots), active Centaurs (stars), and LPCs (triangles). Literature was searched for both snapshot and monitoring observations: Mazzotta Epifani & Palumbo (2011, and references therein), Mazzotta Epifani et al. (2008, and references therein), Solontoi et al. (2012), Szabó et al. (2002), Ivanova et al. (2011), Jewitt (2009), Mazzotta Epifani et al. (2011, 2006), Bauer et al. (2003), Lara et al. (2003), Mazzotta Epifani et al. (2010), Korsun et al. (2010), Mazzotta Epifani et al. (2009, and references therein), Meech et al. (2009). (Right) Median R-band Afρ values in heliocentric distance ranges of 1 AU for SPCs (black diamonds) and LPCs (red diamonds). The number of values available to compute the median is indicated close to each symbol. The black vertical dashed lines indicate the “cloud” (min-max values) for each point in the SPCs’ sample. |
| In the text | |
|
Fig. 6 Dust mass-loss rate of target comets (blue open squares: values computed for the reference velocity of v = 20 m/s; blue vertical lines: min-max range computed by means of the photometric model for grain velocity from 1 to 50 m/s) compared to values for several minor bodies: SPCs (black dots: single observations; black vertical lines: min-max range derived for typical/depleted comet classification or range computed by means of the photometric model for different grain velocity values; see Mazzotta Epifani & Palumbo (2011; their Fig. 12) and references therein), active Centaurs (red stars: single observations; red vertical lines: min-max range computed by means of the photometric model for different grain velocity values; see Mazzotta Epifani et al. 2006, 2011; Bauer et al. 2003; Ivanova et al. 2011), and LPCs (blue triangles: single observations; blue vertical lines: min-max range computed by means of the photometric model for different grain velocity values; see Fulle et al. 1998; Mazzotta Epifani et al. 2009; Ivanova et al. 2011). |
| In the text | |
Current usage metrics show cumulative count of Article Views (full-text article views including HTML views, PDF and ePub downloads, according to the available data) and Abstracts Views on Vision4Press platform.
Data correspond to usage on the plateform after 2015. The current usage metrics is available 48-96 hours after online publication and is updated daily on week days.
Initial download of the metrics may take a while.