Fig. 6
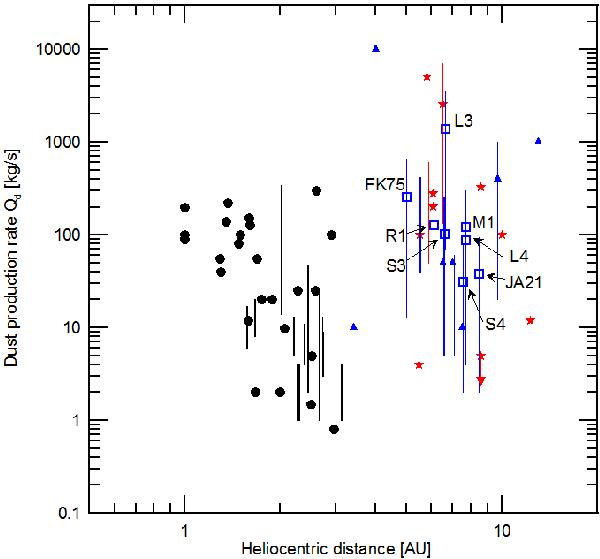
Dust mass-loss rate of target comets (blue open squares: values computed for the reference velocity of v = 20 m/s; blue vertical lines: min-max range computed by means of the photometric model for grain velocity from 1 to 50 m/s) compared to values for several minor bodies: SPCs (black dots: single observations; black vertical lines: min-max range derived for typical/depleted comet classification or range computed by means of the photometric model for different grain velocity values; see Mazzotta Epifani & Palumbo (2011; their Fig. 12) and references therein), active Centaurs (red stars: single observations; red vertical lines: min-max range computed by means of the photometric model for different grain velocity values; see Mazzotta Epifani et al. 2006, 2011; Bauer et al. 2003; Ivanova et al. 2011), and LPCs (blue triangles: single observations; blue vertical lines: min-max range computed by means of the photometric model for different grain velocity values; see Fulle et al. 1998; Mazzotta Epifani et al. 2009; Ivanova et al. 2011).
Current usage metrics show cumulative count of Article Views (full-text article views including HTML views, PDF and ePub downloads, according to the available data) and Abstracts Views on Vision4Press platform.
Data correspond to usage on the plateform after 2015. The current usage metrics is available 48-96 hours after online publication and is updated daily on week days.
Initial download of the metrics may take a while.