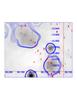
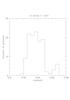
Fig. A.2
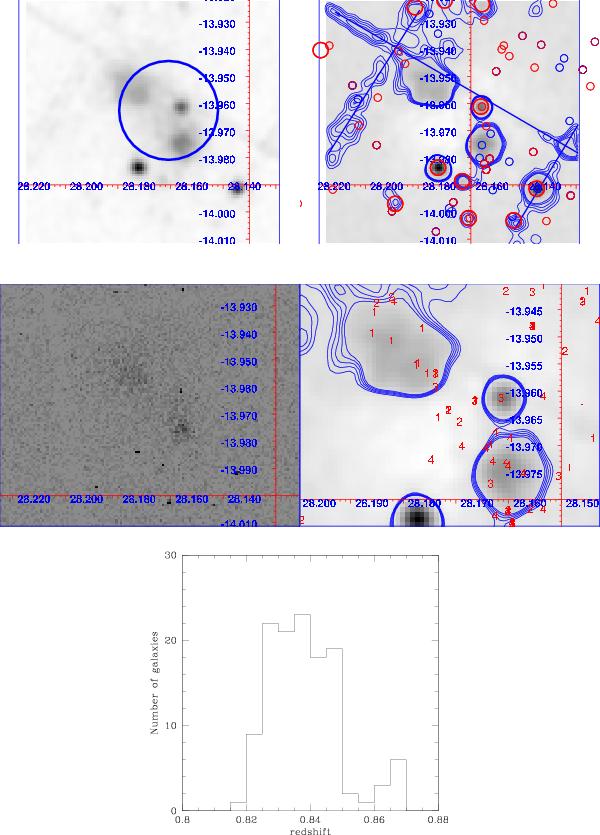
XMM-Newton X-ray image (upper left), residual image with straight blue lines showing the interchip detector gaps (upper right), Chandra image (middle left), and zoom on the residual image (middle right). The residual image was obtained by subtracting the model from the XMM-Newton image for CL J0152.7-1357. The large blue circle in the upper left panel corresponds to a 500 kpc radius circle centred on the cluster position found in the literature. The large red circles in the upper right panel show the positions of the known active objects along the line of sight, the small red circles show the positions of the galaxies belonging to structures beyond the cluster from the SG analysis, and the small blue circles show the positions of the galaxies belonging to structures in front of the cluster from the SG analysis. The red numbers in the middle right panel show the positions of the galaxies belonging to substructures in the cluster from the SG analysis, the number being the one given in Table 2. Finally, blue contours are the X-ray residuals, starting at the 2.5σ level and spaced by 1σ intervals. Lower panel: redshift histogram for CL J0152.7-1357.
Current usage metrics show cumulative count of Article Views (full-text article views including HTML views, PDF and ePub downloads, according to the available data) and Abstracts Views on Vision4Press platform.
Data correspond to usage on the plateform after 2015. The current usage metrics is available 48-96 hours after online publication and is updated daily on week days.
Initial download of the metrics may take a while.