Fig. 4
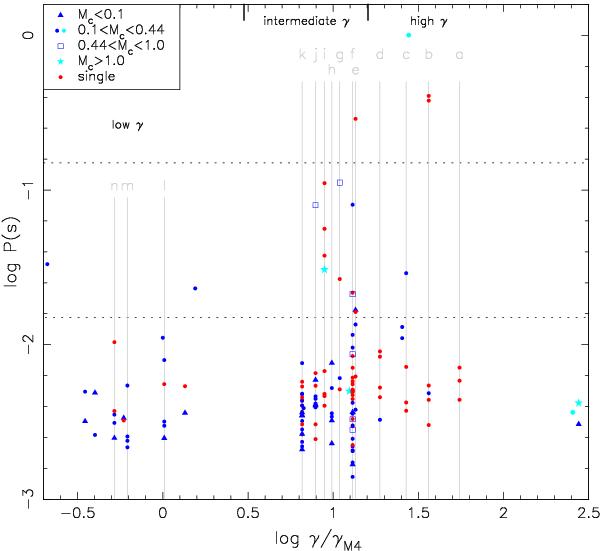
Pulse periods as function of single-binary disruption rate γ. Some of the clusters are labelled as in Table 1, colours are used to discriminate isolated and binary pulsars, and symbols to indicate the companion mass. Binaries created by exchange products are shown in light blue. The horizontal dotted lines indicate pulse periods of 0.15 and 0.015 s.
Current usage metrics show cumulative count of Article Views (full-text article views including HTML views, PDF and ePub downloads, according to the available data) and Abstracts Views on Vision4Press platform.
Data correspond to usage on the plateform after 2015. The current usage metrics is available 48-96 hours after online publication and is updated daily on week days.
Initial download of the metrics may take a while.