Fig. 16
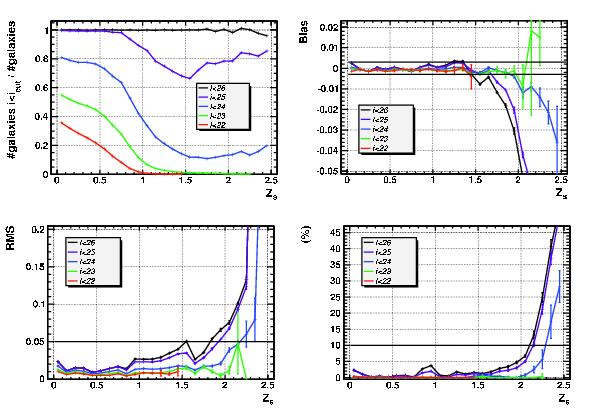
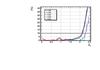
LSST i magnitude selection. Top: evolution of the fraction of detected galaxies with i < icut and the bias with zs. Bottom: evolution of the rms and η as a function of zs. The thick black lines represent the LSST requirements given in Table 2. Ten years of observations with the LSST is assumed. The values of the i-magnitude cuts are reported in the legend.
Current usage metrics show cumulative count of Article Views (full-text article views including HTML views, PDF and ePub downloads, according to the available data) and Abstracts Views on Vision4Press platform.
Data correspond to usage on the plateform after 2015. The current usage metrics is available 48-96 hours after online publication and is updated daily on week days.
Initial download of the metrics may take a while.