Fig. 6
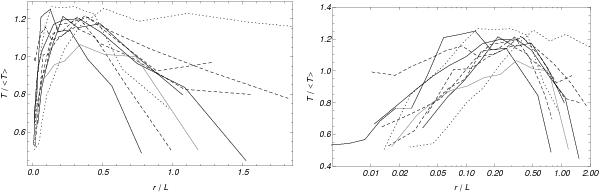
Temperature profiles for all clusters plotted as a function of distance from the centre and in units of the scalar field length L. The temperatures are scaled to the mean (gas-density weighted) cluster temperature. Dashed line is for high temperature clusters (⟨ T ⟩ > 5 keV); solid line is for intermediate temperature clusters (2.5 < ⟨ T ⟩ < 5 keV); dotted line is for low temperature clusters (⟨ T ⟩ < 2.5 keV).
Current usage metrics show cumulative count of Article Views (full-text article views including HTML views, PDF and ePub downloads, according to the available data) and Abstracts Views on Vision4Press platform.
Data correspond to usage on the plateform after 2015. The current usage metrics is available 48-96 hours after online publication and is updated daily on week days.
Initial download of the metrics may take a while.