Free Access
Fig. 3
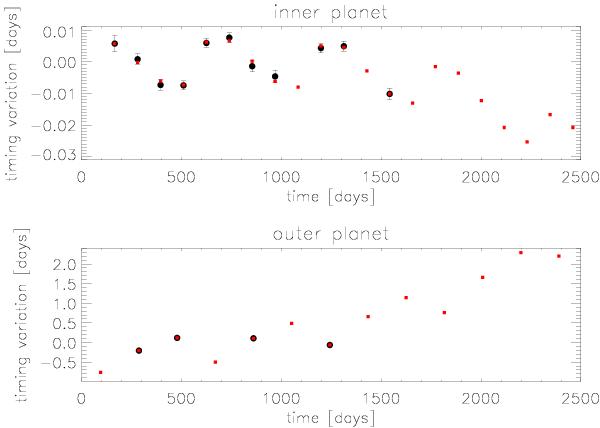
Observed transit timing variations relative to a linear ephemeris (black) over plotted with the best model closest to the parameters of Table 4 (red squares). Top and bottom panels are for Kepler-87 b and c, respectively. The error bars for Kepler-87 c are smaller than the size of the symbols.
Current usage metrics show cumulative count of Article Views (full-text article views including HTML views, PDF and ePub downloads, according to the available data) and Abstracts Views on Vision4Press platform.
Data correspond to usage on the plateform after 2015. The current usage metrics is available 48-96 hours after online publication and is updated daily on week days.
Initial download of the metrics may take a while.