Fig. 1
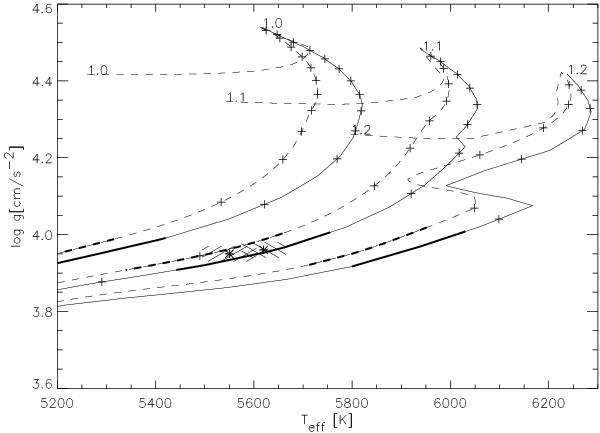
Stellar parameters from Table 1 (shaded area) compared to Padova stellar evolution models (solid line) and Y2 models (dashed line). We note that the models differ slightly in their chemical composition. The bold regions on the tracks indicate the ratio of the stellar radius to the semi-major axis of the planetary orbit derived from its orbital period, the mass of the stellar model, and Kepler’s third law. The “+” symbols indicate 1 Gyr time steps.
Current usage metrics show cumulative count of Article Views (full-text article views including HTML views, PDF and ePub downloads, according to the available data) and Abstracts Views on Vision4Press platform.
Data correspond to usage on the plateform after 2015. The current usage metrics is available 48-96 hours after online publication and is updated daily on week days.
Initial download of the metrics may take a while.