Fig. 6
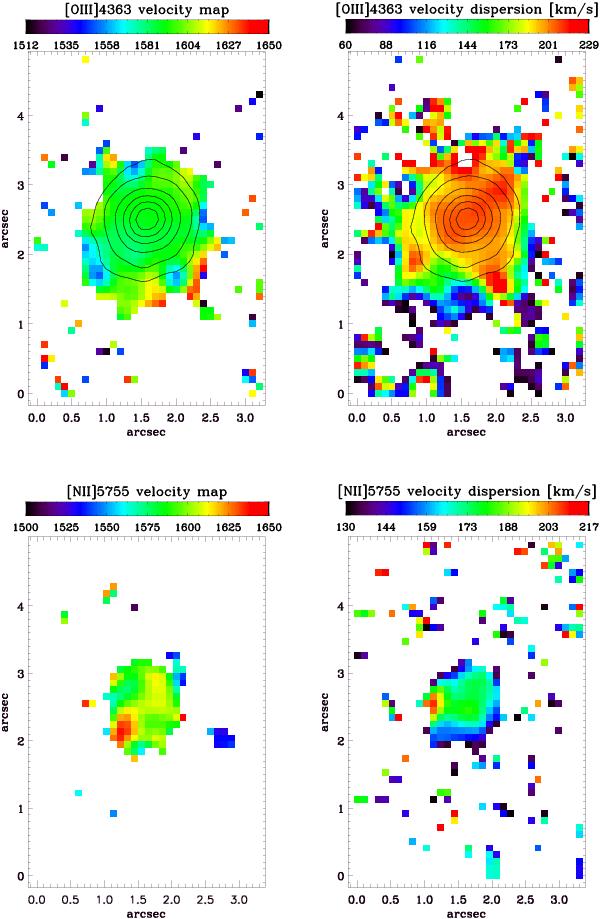
The peculiar kinematics of the [O iii] λ4363 line (upper panels) and of [N ii]λ5755 (lower panels). Contours are the monochromatic intensity of the corresponding emission-line from decreasing intensity intervals of 10-18 erg cm2 s-1in peak intensity. Pixels within the contours are 3σ above noise. North is up and east is left.
Current usage metrics show cumulative count of Article Views (full-text article views including HTML views, PDF and ePub downloads, according to the available data) and Abstracts Views on Vision4Press platform.
Data correspond to usage on the plateform after 2015. The current usage metrics is available 48-96 hours after online publication and is updated daily on week days.
Initial download of the metrics may take a while.