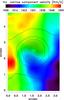
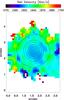
Fig. 4

Radial velocity maps. Left: map of the narrow component of the Hα line. This map is representative of all other narrow-line maps (e.g., narrow [O iii] λ5007, [O i] λ6300, [S ii] λ6717). Right: map of the He i λ7065 line. This map is representative of other broad-line maps (e.g., [O iii] λ4363, broad Hα). Contours are the monochromatic intensity of the corresponding emission-line from decreasing intensity intervals of 2 × 10-17 erg cm2 s-1 in peak intensity for Hα and 10-18 erg cm2 s-1 for He i. Only pixels above 3σ of the noise are shown for He i. In both panels, north is up and east is to the left.
Current usage metrics show cumulative count of Article Views (full-text article views including HTML views, PDF and ePub downloads, according to the available data) and Abstracts Views on Vision4Press platform.
Data correspond to usage on the plateform after 2015. The current usage metrics is available 48-96 hours after online publication and is updated daily on week days.
Initial download of the metrics may take a while.