Fig. 5
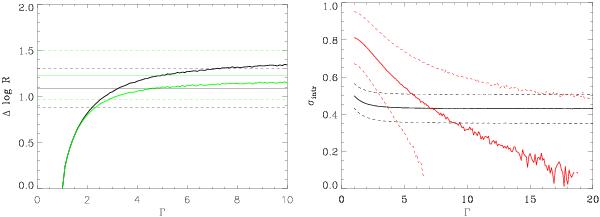
Results of Monte Carlo simulations to derive the jet Lorentz factor Γ and the intrinsic spread of core dominance σintr. The left panel shows the core dominance difference, Δlog R, of a simulated sample of HIGs and BLOs as a function of Γ. The black solid curve is for the average value, while the green line is for the median. The horizontal lines show the observed values, with the dashed lines representing the errors. Right panel: curves of the intrinsic spread of core dominance, σintr, required to reproduced the observed values of the widths of the core dominance distributions for HIGs (black) and BLOs (red) as a function of Γ. At the intercept the constraints for HIGs and BLOs are simultaneously satisfied. The dashed lines for each class are obtained by considering the errors on the dispersions.
Current usage metrics show cumulative count of Article Views (full-text article views including HTML views, PDF and ePub downloads, according to the available data) and Abstracts Views on Vision4Press platform.
Data correspond to usage on the plateform after 2015. The current usage metrics is available 48-96 hours after online publication and is updated daily on week days.
Initial download of the metrics may take a while.