Fig. 6
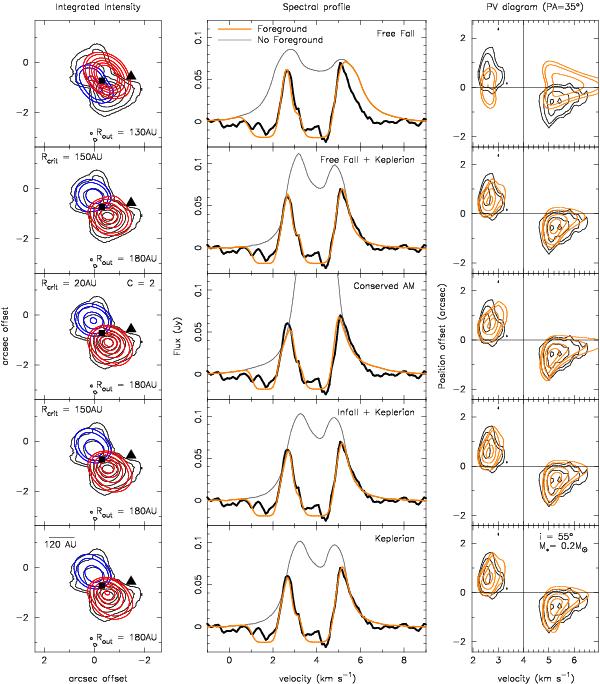
Comparison of C18O observations (black lines) with a thin disk model (colored lines) that includes foreground components. The left column shows moment 0 maps with the red and blue lines showing red and blueshifted emission, respectively. Source positions are marked as in Fig. 2. The middle column compares the spectral profiles with and without foreground. The right column presents the image-space PV diagrams. The models shown here have two foreground components (at 1.6 and 3.0 km s-1) and the resolved-out envelope component (at 4.0 km s-1). Contours both for observations and models are the same as those in Fig. 2. M∗ and i for all models are shown in the right panel.
Current usage metrics show cumulative count of Article Views (full-text article views including HTML views, PDF and ePub downloads, according to the available data) and Abstracts Views on Vision4Press platform.
Data correspond to usage on the plateform after 2015. The current usage metrics is available 48-96 hours after online publication and is updated daily on week days.
Initial download of the metrics may take a while.