Fig. 2
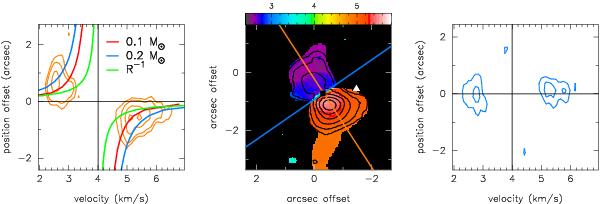
Observed C18O (2−1). Left: pure Keplerian rotation curves (v ∝ R-0.5, red and blue) and infall (v ∝ R-1, green) are overlaid on the PV diagram. This suggests that the emission may be rotationally supported with M∗ ~ 0.1−0.2 M⊙. Center: C18O velocity map (moment 1, halftone) and intensity integrated (moment 0, contours) maps. Contours are in steps of 3σ, 5σ, 10σ, 15σ, 20σ and 25σ with σ = 13 mJy beam-1. VLA1623A and B’s positions are marked with a square and triangle, respectively. Orange and blue lines indicate the image-space PV diagram cuts at PA = 35° (left) and 125° (right), respectively. Right: lack of velocity gradient suggests no outflow contamination on the C18O emission. In both PV diagrams contours are in steps of 3σ, 5σ, 10σ and 15σ where σ = 19 mJy beam-1 and the black lines indicate the systemic velocity and position of VLA1623A.
Current usage metrics show cumulative count of Article Views (full-text article views including HTML views, PDF and ePub downloads, according to the available data) and Abstracts Views on Vision4Press platform.
Data correspond to usage on the plateform after 2015. The current usage metrics is available 48-96 hours after online publication and is updated daily on week days.
Initial download of the metrics may take a while.