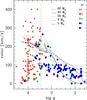
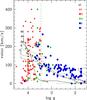
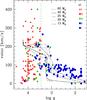
Fig. 9

Projected rotational velocity as a function of surface gravity. The symbols have the same meaning as in Fig. 8. Top: evolutionary tracks from Brott et al. (2011a). Middle: evolutionary tracks from Ekström et al. (2012). Bottom: evolutionary tracks from Chieffi & Limongi (2013). The vertical dashed line is a guideline located at log g = 3.45.
Current usage metrics show cumulative count of Article Views (full-text article views including HTML views, PDF and ePub downloads, according to the available data) and Abstracts Views on Vision4Press platform.
Data correspond to usage on the plateform after 2015. The current usage metrics is available 48-96 hours after online publication and is updated daily on week days.
Initial download of the metrics may take a while.