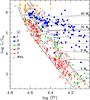
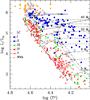
Fig. 8
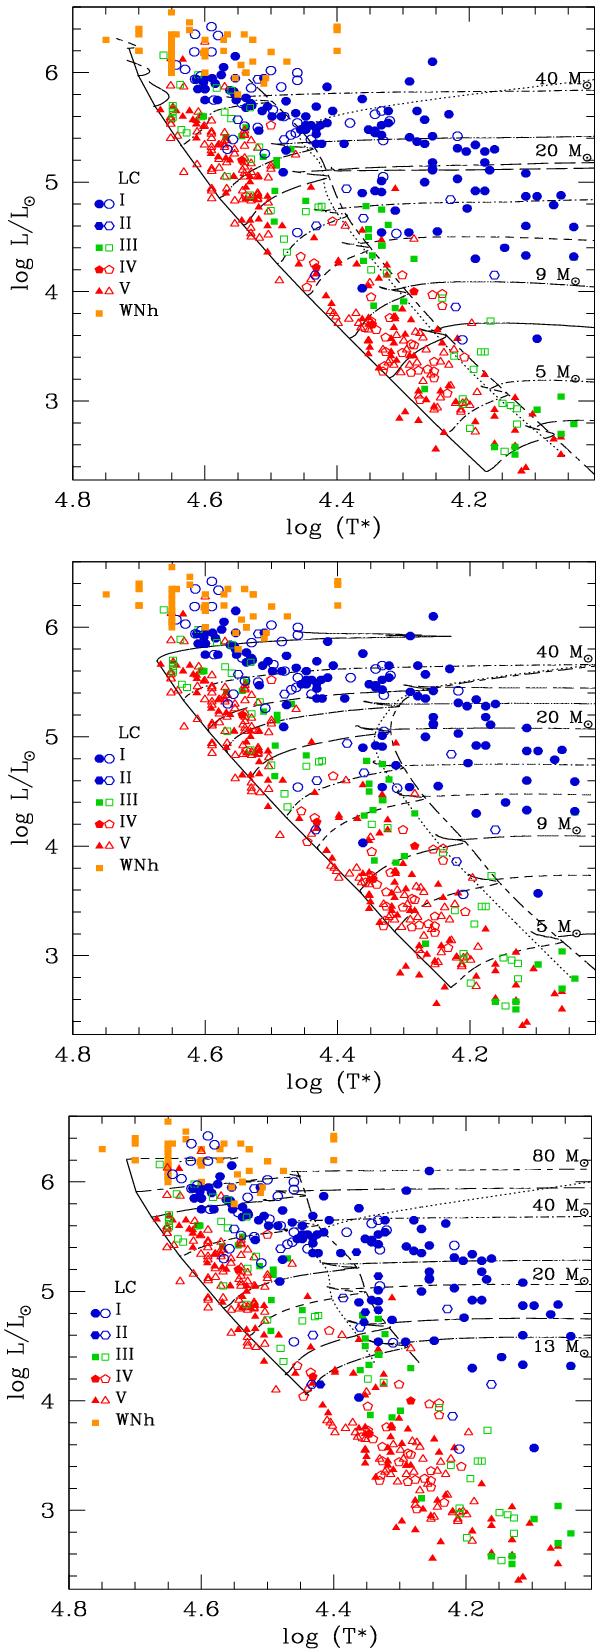
Comparison between evolutionary tracks (black lines) and the location of OB stars in the HR diagram. The evolutionary tracks are from Ekström et al. (2012) (top), Brott et al. (2011a) (middle) and Chieffi & Limongi (2013) (bottom). They are shown for hydrogen mass fraction lower than 0.60 for clarity. The short dashed − long dashed line connects the cooler edge of the main sequence for the different models and defines the TAMS. The dotted lines is the same for the non-rotating models. Different symbols correspond to different luminosity classes. Filled symbols correspond to stars for which the stellar parameters have been determined through a tailored analysis, while open symbols are for stars with parameters taken from calibrations according to their spectral type. The data sources are listed in the text, Sect. 4.1.
Current usage metrics show cumulative count of Article Views (full-text article views including HTML views, PDF and ePub downloads, according to the available data) and Abstracts Views on Vision4Press platform.
Data correspond to usage on the plateform after 2015. The current usage metrics is available 48-96 hours after online publication and is updated daily on week days.
Initial download of the metrics may take a while.