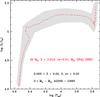
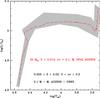
Fig. 3

Region occupied by the evolutionary tracks of 20 M⊙ models computed with MESA (left) and STAREVOL (right) with different opacities, metallicities, mass loss rates and overshooting parameters. The dashed red line shows the track of the standard model, with the parameters as indicated on the figure (the overshooting parameter − ov − is not defined in the same way in both codes, hence the different values). The shaded envelope defines a rough global intrinsic uncertainty on 20 M⊙ models.
Current usage metrics show cumulative count of Article Views (full-text article views including HTML views, PDF and ePub downloads, according to the available data) and Abstracts Views on Vision4Press platform.
Data correspond to usage on the plateform after 2015. The current usage metrics is available 48-96 hours after online publication and is updated daily on week days.
Initial download of the metrics may take a while.