Fig. 5
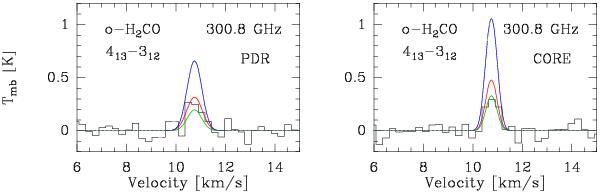
New o - H2CO line detected toward the PDR (left) and dense-core (right) positions. The three color lines plot the radiative-transfer models from Guzmán et al. (2011), where the column density was varied around the best match (red curve) by a factor of 1.5 (blue curve) and 1/1.5 (green curve). The column density used for the best fit is given in Table 6. The line frequency in GHz is given in each box.
Current usage metrics show cumulative count of Article Views (full-text article views including HTML views, PDF and ePub downloads, according to the available data) and Abstracts Views on Vision4Press platform.
Data correspond to usage on the plateform after 2015. The current usage metrics is available 48-96 hours after online publication and is updated daily on week days.
Initial download of the metrics may take a while.