Free Access
Fig. B.2
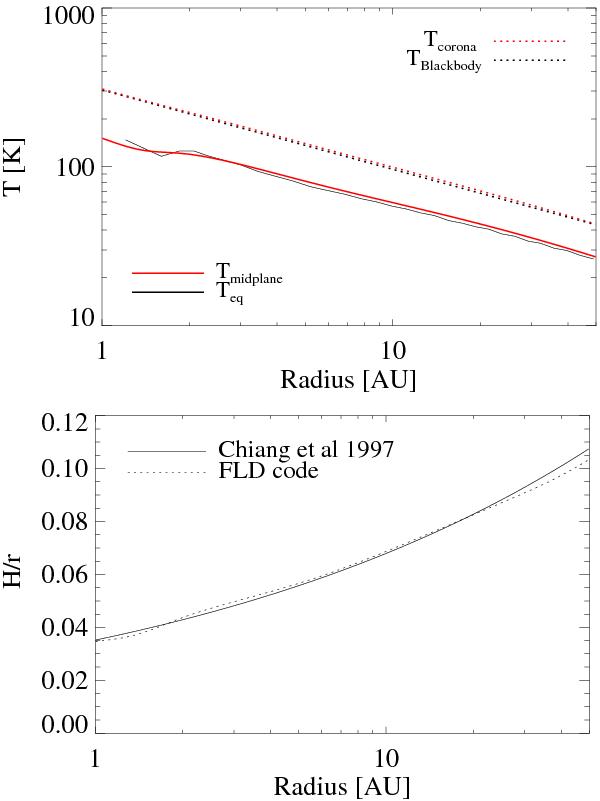
Top: temperature at the disc photosphere (red dotted line) and the midplane (red solid line) overplotted with the analytical prediction (black lines). Bottom: scale height H/r at the midplane (dotted line), overplotted with the analytical prescription by Chiang & Goldreich (1997) (solid line).
Current usage metrics show cumulative count of Article Views (full-text article views including HTML views, PDF and ePub downloads, according to the available data) and Abstracts Views on Vision4Press platform.
Data correspond to usage on the plateform after 2015. The current usage metrics is available 48-96 hours after online publication and is updated daily on week days.
Initial download of the metrics may take a while.